title <- cbbplotR::gt_cbb_logo_title(title ='ACC Regular Season Champions and Best Road Records Since 2008',subtitle ='The team with the best road record has won at least a share of the regular season title 14 of the last 16 seasons.',type ='conference',value ='ACC',logo_height =65)acc_reg_szn |> gt::gt() |> gt::fmt_icon(columns =c(same), rows =c(1:4, 6:12, 14:16), stroke_color ="green", fill_color =c( "green") ) |> gt::fmt_icon(columns =c(same), rows =c(5, 13), stroke_color ="red", fill_color =c( "red") ) |> gtExtras::gt_highlight_rows(rows =c(5, 13), fill ="#fffec8") |> gt::cols_label(year ="Season", winner ="Champion(s)", same ="",team ="Team(s)",away_wins ="W",away_loss ="L", away_wp ="Win %" ) |> gt::fmt_number(columns =c(away_wp), decimals =3) |> gt::tab_spanner(columns =c(team, away_wins, away_loss, away_wp), label ="Best Road Record") |> gt::tab_header(title = gt::html(title)) |> gt::tab_source_note(source_note ="Bless your chart | data via cbbdata + cbbplotR | February 22, 2024") |> cbbplotR::gt_theme_athletic() -> acc_gt_tblgtExtras::gtsave_extra(acc_gt_tbl,filename ="acc_table.png",vheight =875,vwidth =850)acc_gt_tbl
ACC Regular Season Champions and Best Road Records Since 2008 The team with the best road record has won at least a share of the regular season title 14 of the last 16 seasons.
Season
Champion(s)
Best Road Record
Team(s)
W
L
Win %
2008
North Carolina
North Carolina
8
0
1.000
2009
North Carolina
North Carolina
6
2
0.750
2010
Duke, Maryland
Duke, Florida St., Maryland
5
3
0.625
2011
North Carolina
North Carolina
6
2
0.750
2012
North Carolina
Duke
8
0
1.000
2013
Miami FL
Miami FL
7
2
0.778
2014
Virginia
Pittsburgh, Syracuse, Virginia
7
2
0.778
2015
Virginia
Virginia
8
1
0.889
2016
North Carolina
North Carolina
6
3
0.667
2017
North Carolina
North Carolina, Notre Dame, Virginia
5
4
0.556
2018
Virginia
Virginia
9
0
1.000
2019
Virginia, North Carolina
North Carolina
9
0
1.000
2020
Florida State
Virginia
7
3
0.700
2021
Virginia
Virginia
6
3
0.667
2022
Duke
Duke
9
1
0.900
2023
Miami FL, Virginia
Miami FL, Pittsburgh
6
4
0.600
Bless your chart | data via cbbdata + cbbplotR | February 22, 2024
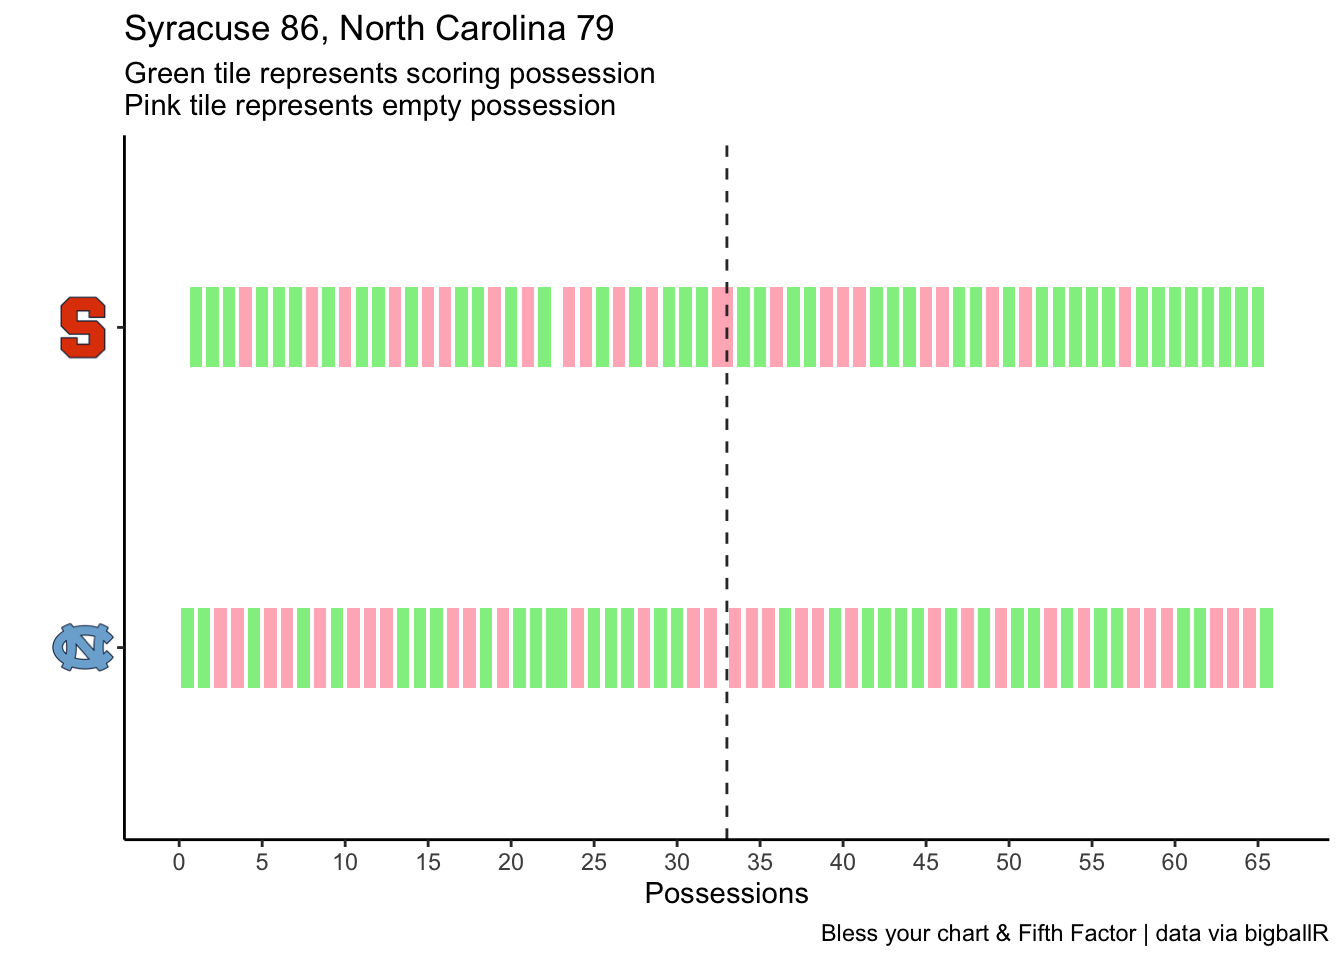
Geom tile possession chart
Code
cuse_poss <- acc_poss |> dplyr::filter(ID ==5618376) |> dplyr::mutate(scoring = dplyr::if_else(PTS >0, TRUE, FALSE))# idea is to use geom_tile to show different empty or scoring possessions # tricky part is Poss_Num is sort of double-counting? # adjusting the x axis manually with labels to try and clear it up # basically think you can divide by 2? # find half time row_index <-which(cuse_poss$Half_Status ==2)[1]first_poss_num <- cuse_poss$Poss_Num[row_index] /2cuse_plot <- cuse_poss |> ggplot2::ggplot(ggplot2::aes(x = Poss_Num/2, y = Poss_Team, fill = scoring)) + ggplot2::geom_tile(width =0.75, height =0.25) + ggplot2::scale_fill_manual(values =c("lightpink", "lightgreen")) + ggplot2::scale_x_continuous(breaks =seq(0, 70, 5), limits =c(0, 66)) + ggplot2::geom_vline(xintercept = first_poss_num, linetype ="dashed", color ="#333333") + ggplot2::theme_classic() + ggplot2::theme(legend.position ="none",axis.text.y = cbbplotR::element_cbb_teams(size =0.9)) + ggplot2::labs(x ="Possessions", y ="", title ="Syracuse 86, North Carolina 79",subtitle ="Green tile represents scoring possession \nPink tile represents empty possession", caption ="Bless your chart & Fifth Factor | data via bigballR")ggplot2::ggsave("cuse-plot.png", cuse_plot,w =6,h =4,dpi =300,type ='cairo')cuse_plot
Road records since 2012 - UVA
Code
since_uva <- cbbdata::cbd_torvik_game_stats(type ="conf", team ="North Carolina") |> dplyr::filter(location =="A"& year >2012) |> dplyr::group_by(opp) |> dplyr::summarise(W =sum(result =="W"), L =sum(result =="L"),win_pct = W / (W+L) ) |> dplyr::arrange(win_pct)since_uva
# A tibble: 15 × 4
   opp                    W     L win_pct
   <chr>              <int> <int>   <dbl>
 1 Virginia               0     8   0
 2 Duke                   4     7   0.364
 3 Wake Forest            3     4   0.429
 4 Notre Dame             3     3   0.5
 5 Virginia Tech          3     3   0.5
 6 Louisville             4     3   0.571
 7 Miami FL               4     3   0.571
 8 Pittsburgh             4     3   0.571
 9 Syracuse               4     3   0.571
10 Florida St.            5     3   0.625
11 Georgia Tech           5     3   0.625
12 Clemson                6     2   0.75
13 North Carolina St.     9     3   0.75
14 Boston College         7     0   1
15 Maryland               1     0   1