# make the table bball_header <- glue::glue("<div style='display: flex; justify-content: space-between; align-items: center;'> <div> <img src='https://a.espncdn.com/combiner/i?img=/redesign/assets/img/icons/ESPN-icon-basketball.png' style='height: 40px; width: auto; vertical-align: middle;'> </div> <div style='flex-grow:1; margin-left: 30px; margin-right: 30px'> <span style='display: block; font-weight: bold; text-align: center; font-size: 24px;'>Free Throw Rate Changes by Season</span> <span style='font-size: 14px; font-weight: normal; display: block; text-align: center;'>Shows the Free Throw Rate percentile for a given value by season.<br>Only games played <em>before</em> December 29 of each season.</span> </div> <div> <img src='https://a.espncdn.com/combiner/i?img=/redesign/assets/img/icons/ESPN-icon-basketball.png' style='height: 40px; width: auto; vertical-align: middle;'> </div> </div> <br>")lookup_values <-seq(30, 40, by =1)ptile <- sum_tbl |> dplyr::group_by(year) |> dplyr::summarise(stats =list( purrr::map_df(lookup_values, ~tibble::tibble(target_ftr = .x,percentile = stats::ecdf(ftr)(.x) )) ),.groups ="drop" ) |> tidyr::unnest(stats) |> tidyr::pivot_wider(names_from = year, values_from = percentile ) |> dplyr::rename("FTR"= target_ftr)ftr_tbl <- ptile |> dplyr::arrange(-FTR) |> gt::gt() |> gtUtils::gt_theme_gtutils() |> gtUtils::gt_column_subheaders(`FTR`=list(heading ="FTR", subtitle ="FTA/FGA * 100"),`2022`=list(heading ="2021-22", subtitle ="358 teams"),`2023`=list(heading ="2022-23", subtitle ="363 teams"),`2024`=list(heading ="2023-24", subtitle ="362 teams"),`2025`=list(heading ="2024-25", subtitle ="364 teams"),`2026`=list(heading ="2025-26", subtitle ="365 teams"),heading_color ="black",subtitle_color ="gray" ) |> gt::fmt_number(columns =c(FTR),decimals =1 ) |> gt::fmt_percent(columns =c(-FTR),decimals =1 ) |> gt::data_color(columns =c(-FTR),direction =c("column"),method =c("numeric"),palette =c("#d7191c", "#fdae61", "#ffffbf", "#a6d96a", "#1a9641"),domain =c(.15, .999),alpha =0.6, ) |> gt::tab_header(title = gt::html(bball_header)) |> gt::tab_source_note(source_note = gt::html("<hr>Data via barttorvik.com | theme via {gtUtils} <br> Data only for games played in a given season before December 29<br> <hr><b>Table by Chris at Bless your chart</b>" ) ) |> gt::tab_options(table.width = gt::px(550)) |> gt::tab_style(locations = gt::cells_source_notes(),style = gt::cell_text(font = gt::google_font("Signika Negative"),size = gt::px(11.5),weight =250 ) ) |> gt::tab_style(style =list( gt::cell_text(font = gt::google_font("Signika Negative"),size = gt::px(14) ) ),locations = gt::cells_body(rows = gt::everything(),columns = gt::everything() ) ) |> gt::tab_style(style =list(gt::cell_borders(sides =c("left", "right", "top", "bottom"),color ="black",weight = gt::px(2) )),locations =list( gt::cells_body(), gt::cells_column_labels(), gt::cells_row_groups() ) ) |> gtUtils::gt_border_bars_bottom(c("#0d1e2d", "#c1d6e2","#f07e1d"))gt_save_crop( ftr_tbl,file ="ftr_tbl.png",whitespace =40,bg ="#FFFDF5")ftr_tbl
Free Throw Rate Changes by SeasonShows the Free Throw Rate percentile for a given value by season.
Only games played before December 29 of each season.
FTR FTA/FGA * 100
2021-22 358 teams
2022-23 363 teams
2023-24 362 teams
2024-25 364 teams
2025-26 365 teams
40.0
96.9%
92.0%
89.0%
86.8%
77.0%
39.0
95.5%
89.8%
85.1%
83.2%
72.1%
38.0
93.3%
88.2%
81.5%
79.4%
66.3%
37.0
89.9%
85.4%
76.5%
76.6%
60.8%
36.0
86.6%
82.4%
69.3%
71.2%
54.2%
35.0
83.5%
78.5%
64.6%
65.7%
46.8%
34.0
79.1%
71.1%
56.4%
57.7%
40.3%
33.0
71.8%
65.8%
50.6%
50.8%
35.1%
32.0
64.8%
56.7%
44.2%
44.8%
30.1%
31.0
60.1%
52.1%
38.1%
36.3%
24.1%
30.0
54.7%
47.4%
31.8%
31.6%
18.6%
Data via barttorvik.com | theme via {gtUtils}
Data only for games played in a given season before December 29 Table by Chris at Bless your chart
FTR beeswarm
Code
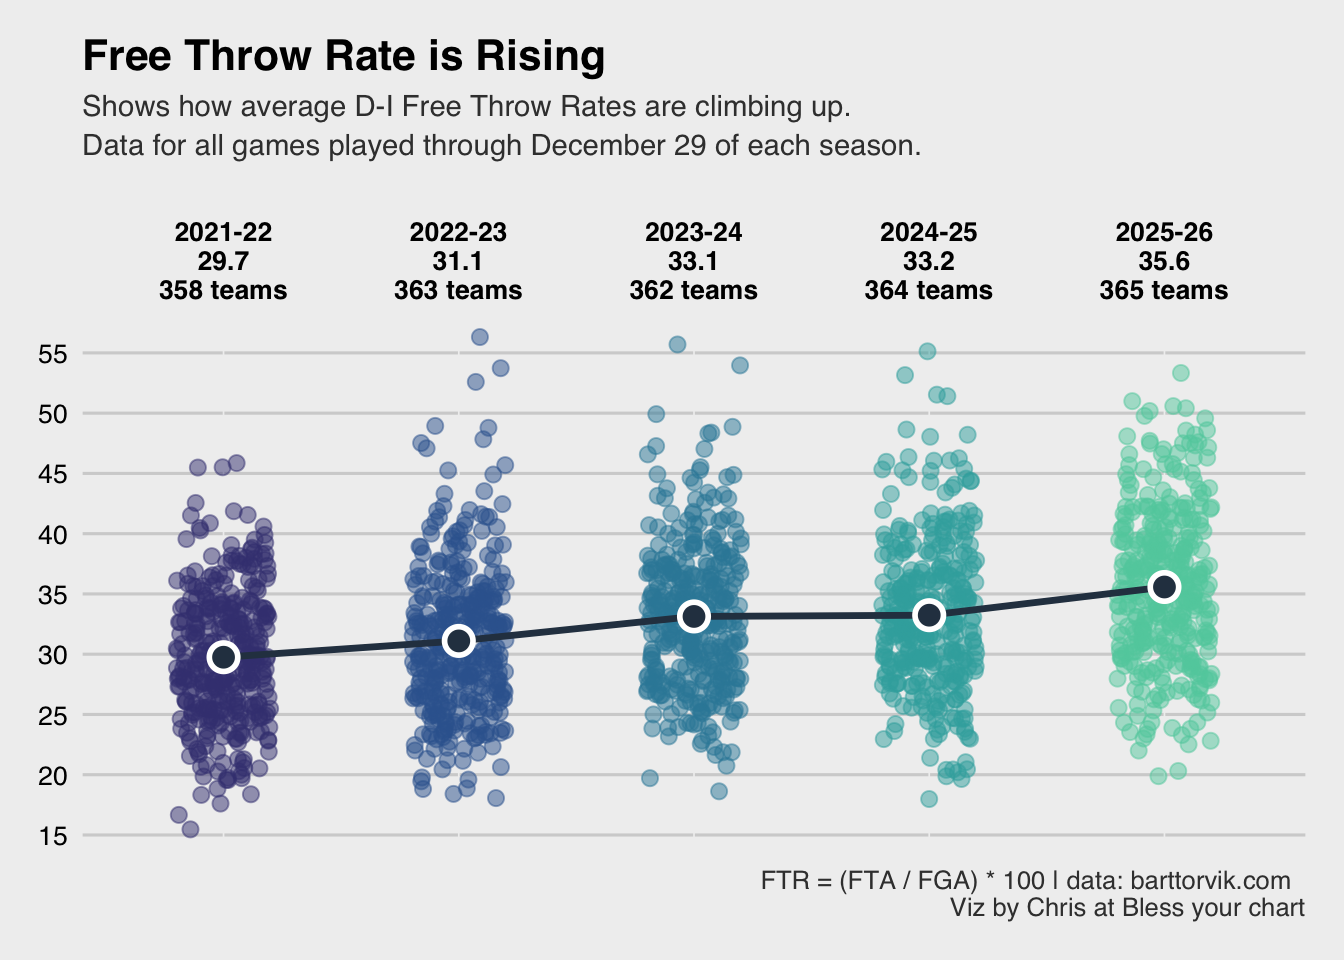
ftr_plot <- sum_tbl |> dplyr::mutate(year_label = dplyr::case_match( year,2022~"2021-22\n29.7\n358 teams",2023~"2022-23\n31.1\n363 teams",2024~"2023-24\n33.1\n362 teams",2025~"2024-25\n33.2\n364 teams",2026~"2025-26\n35.6\n365 teams" ) ) |> ggplot2::ggplot(ggplot2::aes(x =factor(year_label), y = ftr)) + ggplot2::geom_jitter( ggplot2::aes(color =factor(year)),width =0.2,alpha =0.5,size =2.5,show.legend =FALSE ) + ggplot2::stat_summary(fun = mean,geom ="line", ggplot2::aes(group =1),color ="#2c3e50",linewidth =1.2 ) + ggplot2::stat_summary(fun = mean,geom ="point",shape =21,fill ="#2c3e50",color ="white",size =4,stroke =1.5 ) + ggplot2::scale_color_viridis_d(option ="mako",begin =0.3,end =0.8) + ggplot2::scale_x_discrete(position ="top") + ggplot2::scale_y_continuous(breaks =seq(15, 55, 5)) + ggplot2::labs(title ="Free Throw Rate is Rising",subtitle ="Shows how average D-I Free Throw Rates are climbing up. \nData for all games played through December 29 of each season. \n",x ="",y ="FT Rate (FTR)",caption ="FTR = (FTA / FGA) * 100 | data: barttorvik.com \nViz by Chris at Bless your chart" ) + ggthemes::theme_fivethirtyeight() + ggplot2::theme(# text = ggplot2::element_text(family = "mono"),plot.title = ggplot2::element_text(color ="black",face ="bold",size =16 ),plot.subtitle = ggplot2::element_text(size =11, lineheight =1.1),axis.text.x.top = ggplot2::element_text(face ="bold",color ="black",size =10 ),axis.text.y = ggplot2::element_text(color ="black",size =10 ),legend.position ="none",panel.grid.major.x = ggplot2::element_line(color ="#f0f0f0", linewidth =0.3) )ggplot2::ggsave("ftr_plot.png", ftr_plot,w =6.5,h =7.5,dpi =600,type ="cairo")ftr_plot