team_colors <- c(
"Miami" = "#F47321",
"Notre Dame" = "#0C2340",
"Alabama" = "#9E1B32"
)
cfbranks_complete <- cfbranks_complete |>
dplyr::mutate(
highlight = dplyr::case_when(team %in% names(team_colors) ~ team, TRUE ~ "Other"),
highlight = factor(highlight, levels = c(names(team_colors), "Other"))
)
left_labels <- cfbranks_complete |>
dplyr::filter(week == first_week, rank <= 25) |>
dplyr::arrange(rank)
right_labels <- cfbranks_complete |>
dplyr::filter(week == last_week, rank <= 25) |>
dplyr::arrange(rank) |>
dplyr::left_join(records_manual, by = "team")
left_labels <- left_labels |>
dplyr::mutate(
still_ranked = team %in% right_labels$team,
left_alpha = ifelse(still_ranked, 1, 0.35)
)
ggplot2::ggplot(cfbranks_complete,
ggplot2::aes(
x = week,
y = rank,
group = team,
color = highlight,
)) +
ggbump::geom_bump(ggplot2::aes(alpha = highlight),
smooth = 8,
size = 0.8) +
ggplot2::geom_point(ggplot2::aes(alpha = highlight), size = 1.8) +
ggplot2::scale_alpha_manual(
values = c(
"Miami" = 0.9,
"Notre Dame" = 0.9,
"Alabama" = 0.9,
"Other" = 0.25
),
guide = "none"
) +
cfbplotR::geom_cfb_logos(
data = left_labels,
ggplot2::aes(x = first_week - 0.25, y = rank, team = team),
alpha = left_labels$left_alpha,
width = 0.020,
inherit.aes = FALSE
) +
cfbplotR::geom_cfb_logos(
data = right_labels,
ggplot2::aes(x = last_week + 0.30, y = rank, team = team),
alpha = 1,
width = 0.020,
inherit.aes = FALSE
) +
ggplot2::geom_text(
data = right_labels,
ggplot2::aes(x = last_week + 0.18, y = rank, label = rank),
inherit.aes = FALSE,
size = 3,
hjust = 1
) +
ggplot2::geom_text(
data = right_labels,
ggplot2::aes(x = last_week + 0.46, y = rank, label = Record),
inherit.aes = FALSE,
hjust = 0,
size = 3,
na.rm = TRUE
) +
ggplot2::geom_vline(
xintercept = future_week + 0.8,
linetype = "dashed",
color = "gray50",
linewidth = 0.5
) +
ggplot2::scale_y_reverse(
breaks = 1:26,
labels = c(1:25, "NR"),
limits = c(26, 1)
) +
ggplot2::scale_x_continuous(
breaks = c(first_week - 0.6, all_weeks, future_week + 0.8),
labels = c("Oct. 28", paste0("Week ", all_weeks), "Week 16 (TBD)"),
expand = ggplot2::expansion(mult = c(0.10, 0.18)),
position = "top"
) +
ggplot2::scale_color_manual(values = c(team_colors, "Other" = "gray75"),
guide = "none") +
ggplot2::scale_linewidth_manual(
values = c(
"Miami" = 1.2,
"Notre Dame" = 1.2,
"Alabama" = 1.2,
"Other" = 0.6
),
guide = "none"
) +
ggplot2::labs(
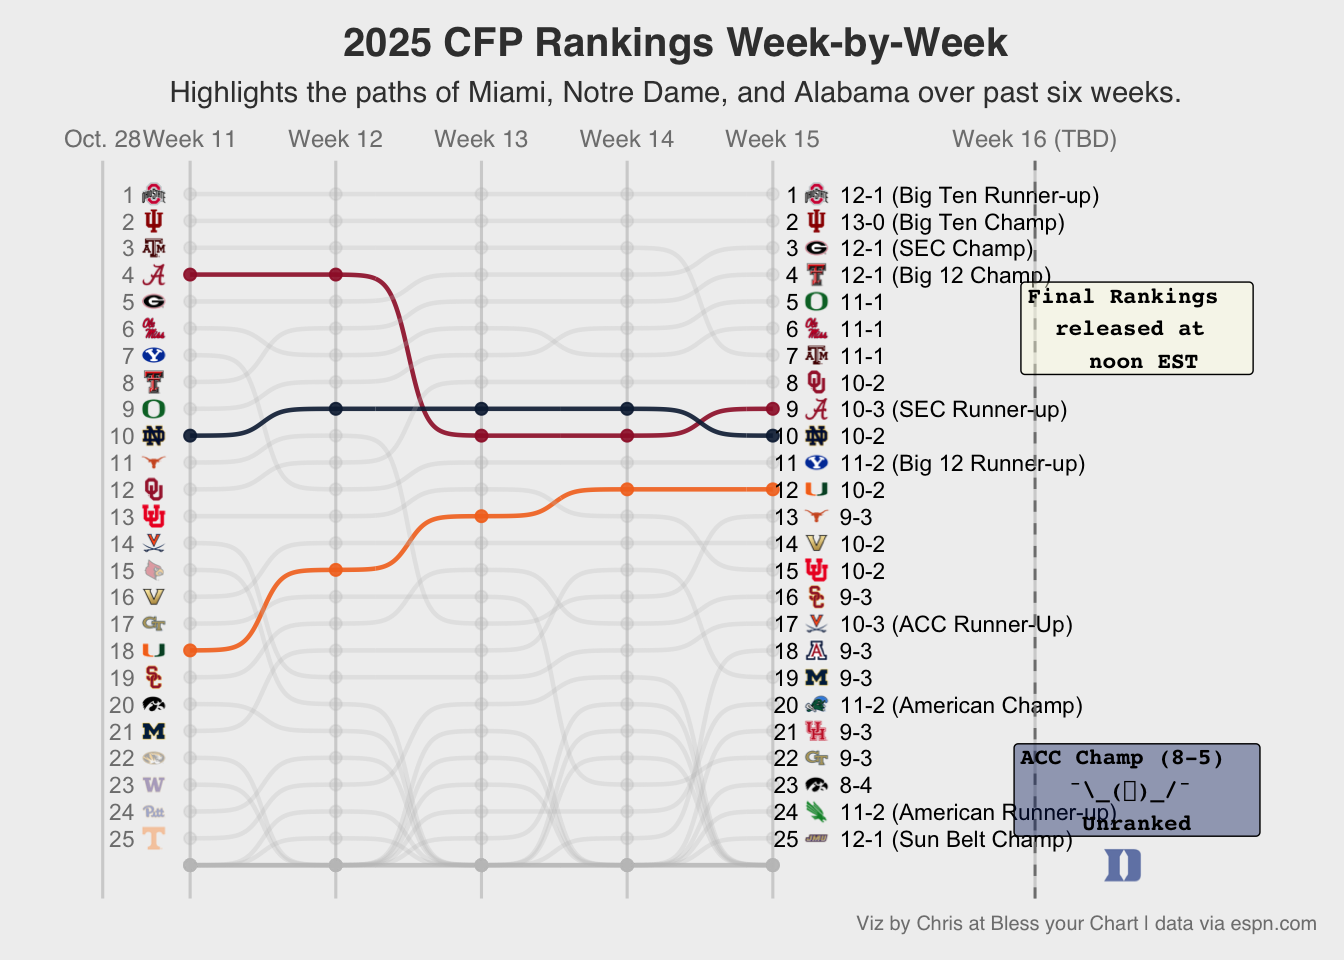
title = "2025 CFP Rankings Week-by-Week",
subtitle = "Highlights the paths of Miami, Notre Dame, and Alabama over past six weeks.",
caption = "Viz by Chris at Bless your Chart | data via espn.com",
x = NULL,
y = NULL
) +
ggplot2::geom_text(
data = left_labels,
ggplot2::aes(x = first_week - 0.38, y = rank, label = rank),
inherit.aes = FALSE,
size = 3,
hjust = 1,
color = "gray50"
) +
ggthemes::theme_fivethirtyeight() +
ggplot2::theme(
legend.position = "none",
panel.grid.major.y = ggplot2::element_blank(),
axis.text.y = ggplot2::element_blank(),
axis.text.x = ggplot2::element_text(size = 9, color = "gray50"),
plot.caption = ggplot2::element_text(size = 7.5, color = "gray50"),
plot.title = ggplot2::element_text(face = "bold", size = 15, hjust = 0.5),
plot.subtitle = ggplot2::element_text(size = 11, hjust = 0.5),
plot.margin = ggplot2::margin(10, 10, 10, 10)
) +
ggplot2::annotate(
cfbplotR::GeomCFBlogo,
x = 17.4,
y = 26,
team = "Duke",
height = .055,
alpha = 0.6
) +
ggplot2::annotate(
geom = "label",
x = 17.5,
y = 23.2,
label = "ACC Champ (8-5) \n ¯\\_(ツ)_/¯ \nUnranked",
alpha = 0.4,
size = 3,
fill = "#012169",
fontface = 'bold',
family = 'mono',
) +
ggplot2::annotate(
geom = "label",
x = 17.5,
y = 6,
label = "Final Rankings \n released at \n noon EST",
alpha = 0.4,
size = 3,
fill = "#ffffe5",
fontface = 'bold',
family = 'mono',
) -> bump_plot
ggplot2::ggsave(
"bump_plot_2.png",
bump_plot,
w = 10.3,
h = 7,
dpi = 600,
type = "cairo"
)
bump_plot