Code
library(rlang)
library(cbbplotR)

# code for this is added to evidence.dev
# see this repo, loading a csv to make it faster for quarto
# https://github.com/gallochris/evdev-byc
games_fbs_teams_final <- readr::read_csv("2025_cfb_games.csv")library(rlang)
library(cbbplotR)
# code for this is added to evidence.dev
# see this repo, loading a csv to make it faster for quarto
# https://github.com/gallochris/evdev-byc
games_fbs_teams_final <- readr::read_csv("2025_cfb_games.csv")options(chromote.headless = "new")
power_conferences <- c("ACC", "Big 12", "SEC", "Big Ten")
power_conf_matchups <- games_fbs_teams_final |>
dplyr::filter(
conference %in% power_conferences,
opponentConference %in% power_conferences,
!conferenceGame, # Non-conference only
opponentClassification == "fbs" # FBS opponents only
) |>
dplyr::select(
team,
conference,
opponent,
opponentConference,
week,
gameDate
) |>
dplyr::mutate(
matchup = paste0(conference, " vs ", opponentConference)
)
# create a summary of all matchups
matchup_summary <- power_conf_matchups |>
dplyr::group_by(conference, opponentConference) |>
dplyr::summarise(
games = dplyr::n(),
.groups = "drop"
) |>
dplyr::filter(conference != opponentConference)
# set order
conf_order <- c("SEC", "Big Ten", "ACC", "Big 12")
# pivot data to make a table
conf_tbl <- matchup_summary |>
tidyr::pivot_wider(
names_from = opponentConference,
values_from = games,
values_fill = NA
) |>
dplyr::select(conference, all_of(conf_order)) |>
dplyr::arrange(factor(conference, levels = conf_order))
# add custom header
fball_header <- glue::glue(
"<div style='display: flex; justify-content: space-between; align-items: center;'>
<div>
<img src='https://a.espncdn.com/combiner/i?img=/redesign/assets/img/icons/ESPN-icon-football-college.png'
style='height: 40px; width: auto; vertical-align: middle;'>
</div>
<div style='flex-grow:1; margin-left: 30px; margin-right: 30px'>
<span style='display: block; font-weight: bold; text-align: center; font-size: 24px;'>2025 Non-Conference Games<br>Between <em>Power</em> Conferences</span>
<span style='font-size: 14px; font-weight: normal; display: block; text-align: center;'>Shows number of games between these four conferences during the 2025 college football regular season.</span>
</div>
<div>
<img src='https://a.espncdn.com/combiner/i?img=/redesign/assets/img/icons/ESPN-icon-football-college.png'
style='height: 40px; width: auto; vertical-align: middle;'>
</div>
</div>
<br>"
)
# make a tbl
gt_conf <- conf_tbl |>
dplyr::mutate(
conference = dplyr::case_match(
conference,
"SEC" ~
"<img src='http://sportslogohistory.com/wp-content/uploads/2017/12/southeastern_conference_2008-pres.png' style='height: 35px; width: auto; vertical-align: -30%;'>",
"Big Ten" ~
"<img src='http://sportslogohistory.com/wp-content/uploads/2017/12/big_ten_conference_2012-pres.png' style='height: 35px; width: auto; vertical-align: -30%;'>",
"ACC" ~
"<img src='https://theacc.com/images/2018/9/21/logo_acc_football.png?preset=large.storyimage' style='height: 35px; width: auto; vertical-align: -30%;'>",
"Big 12" ~
"<img src='https://upload.wikimedia.org/wikipedia/commons/thumb/2/29/Big_12_Conference_%28cropped%29_logo.svg/300px-Big_12_Conference_%28cropped%29_logo.svg.png' style='height: 35px; width: auto; vertical-align: -30%;'>"
)
) |>
gt::gt() |>
gtUtils::gt_theme_gtutils() |>
gt::fmt_markdown(conference) |>
gt::tab_header(
title = gt::html(fball_header)
) |>
gt::tab_source_note(
source_note = gt::html(
"<hr>Data via collegefootballdata.com | theme via {gtUtils} + logos from espn.com <br><hr> <b>Table by Chris at Bless your Chart</b><hr>"
)
) |>
gt::cols_label(
conference = ""
) |>
gtUtils::gt_column_subheaders(
SEC = list(heading = "SEC", subtitle = "16 teams"),
`Big Ten` = list(heading = "Big Ten", subtitle = "18 teams"),
ACC = list(heading = "ACC", subtitle = "17 teams"),
`Big 12` = list(heading = "Big 12", subtitle = "16 teams"),
heading_color = "black",
subtitle_color = "gray"
) |>
gt::cols_label(conference = "") |>
gt::data_color(
columns = -conference,
fn = scales::col_numeric(
palette = c("#fee8c8", "#fdbb84", "#e34a33"),
domain = NULL
)
) |>
gt::sub_missing(missing_text = "---") |>
gt::cols_align(
align = "center",
columns = -conference
) |>
gt::tab_style(
style = gt::cell_text(weight = "bold"),
locations = gt::cells_column_labels()
) |>
gt::tab_style(
style = gt::cell_text(weight = "bold"),
locations = gt::cells_body(columns = conference)
) |>
gt::fmt_number(
columns = -conference,
decimals = 0,
pattern = "{x}"
) |>
gtUtils::gt_border_grid(
color = "black",
weight = 0.5,
include_labels = FALSE
) |>
gtUtils::gt_border_bars_bottom(c("#00B2A9", "#EF426F", "#FF8200")) |>
gt::tab_options(
table.width = gt::px(575),
data_row.padding = gt::px(10),
column_labels.padding = gt::px(8)
) |>
gt::tab_style(
locations = gt::cells_source_notes(),
style = gt::cell_text(
font = gt::google_font("Signika Negative"),
size = gt::px(11.5),
weight = 250
)
) |>
gt::tab_style(
style = list(gt::cell_text(
font = gt::google_font("Signika Negative"),
size = gt::px(15.5)
)),
locations = gt::cells_body(columns = c(conference))
) |>
gt::cols_width(
conference ~ gt::px(100),
everything() ~ gt::px(60)
)
gtUtils::gt_save_crop(
gt_conf,
file = "power_tbl.png",
whitespace = 50,
bg = "#FFFDF5"
)
gt_conf
2025 Non-Conference Games
Between Power Conferences Shows number of games between these four conferences during the 2025 college football regular season. |
||||
|---|---|---|---|---|
SEC 16 teams |
Big Ten 18 teams |
ACC 17 teams |
Big 12 16 teams |
|
 |
— | 3 | 10 | 3 |
 |
3 | — | 3 | 4 |
| 10 | 3 | — | 7 | |
| 3 | 4 | 7 | — | |
Data via collegefootballdata.com | theme via {gtUtils} + logos from espn.com Table by Chris at Bless your Chart |
||||
network_matchups <- games_fbs_teams_final |>
dplyr::filter(
(conference %in% power_conferences | team == "Notre Dame"),
(opponentConference %in% power_conferences | opponent == "Notre Dame"),
!conferenceGame, # Non-conference only
opponentClassification == "fbs" # FBS opponents only
) |>
dplyr::select(team, conference, opponent, opponentConference, week, gameDate)
edges_power <- network_matchups |>
dplyr::select(from = team, to = opponent) |>
dplyr::distinct()
nodes_power <- tibble::tibble(
name = unique(c(edges_power$from, edges_power$to))
) |>
dplyr::left_join(
games_fbs_teams_final |>
dplyr::select(team, conference) |>
dplyr::distinct() |>
dplyr::rename(name = team),
by = "name"
) |>
dplyr::mutate(
conference = dplyr::if_else(name == "Notre Dame", "Independent", conference)
)
graph_power <- tidygraph::tbl_graph(
nodes = nodes_power,
edges = edges_power,
directed = FALSE
)
node_positions <- graph_power |>
ggraph::create_layout(layout = 'stress') |>
dplyr::select(x, y, name)
nodes_with_positions <- dplyr::left_join(
nodes_power,
node_positions,
by = "name"
)
power_network_plot <- graph_power |>
ggraph::ggraph(layout = 'fr') + # Fruchterman-Reingold layout: https://github.com/gephi/gephi/wiki/Fruchterman-Reingold
ggraph::geom_edge_link(
ggplot2::aes(alpha = 0.2),
color = 'gray40',
show.legend = FALSE
) +
ggraph::geom_node_point(
ggplot2::aes(color = conference),
size = 12,
alpha = 0.5
) +
ggraph::geom_node_text(
ggplot2::aes(label = name),
size = 2.5,
fontface = "bold",
color = "black",
repel = TRUE
) +
ggplot2::scale_color_manual(
values = c(
'SEC' = '#d4a017',
'ACC' = '#2e5194',
'Big Ten' = '#c0392b',
'Big 12' = '#1e7d32',
'Independent' = '#5d6d7e'
),
labels = c(
'SEC' = 'SEC',
'ACC' = 'ACC',
'Big Ten' = 'Big Ten',
'Big 12' = 'Big 12',
'Independent' = 'Notre Dame'
),
name = ''
) +
ggplot2::theme_minimal() +
ggplot2::labs(
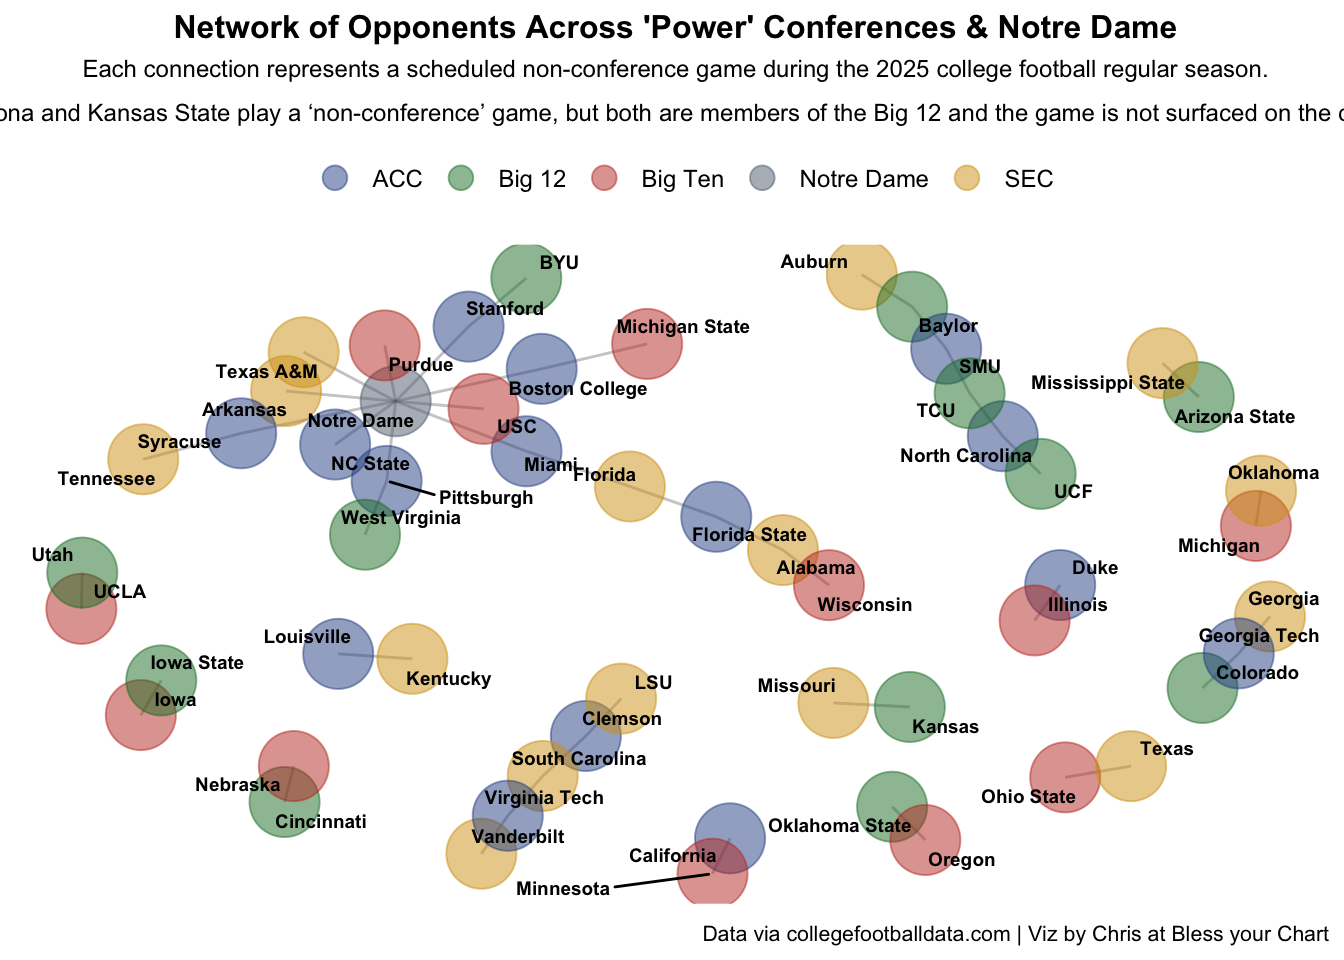
title = "Network of Opponents Across 'Power' Conferences & Notre Dame",
subtitle = "Each connection represents a scheduled non-conference game during the 2025 college football regular season.<br><br>Arizona and Kansas State play a 'non-conference' game, but both are members of the Big 12 and the game is not surfaced on the chart.",
caption = "Data via collegefootballdata.com | Viz by Chris at Bless your Chart"
) +
ggplot2::theme(
plot.title = ggplot2::element_text(hjust = 0.5, size = 12, face = 'bold'),
plot.subtitle = ggtext::element_markdown(hjust = 0.5, size = 9),
plot.caption = ggplot2::element_text(size = 8),
legend.position = "top",
legend.title = ggplot2::element_text(size = 10),
legend.text = ggplot2::element_text(size = 9),
panel.grid = ggplot2::element_blank(),
axis.text = ggplot2::element_blank(),
axis.title = ggplot2::element_blank()
) +
ggplot2::guides(
color = ggplot2::guide_legend(override.aes = list(alpha = 0.5, size = 4))
)
ggplot2::ggsave(
"power_network_plot.png",
power_network_plot,
w = 10.5,
h = 8.5,
bg = "white",
dpi = 600,
type = 'cairo'
)
power_network_plot