ACC Baseball Record MatrixFinal regular season conference records.
19-11 | 0.633
-
-
-
-
1-2
1-2
2-1
-
0-3
2-1
3-0
2-1
3-0
-
2-1
3-0
17-10 | 0.630
-
-
1-2
-
2-1
-
-
1-2
2-1
1-2
2-1
3-0
-
3-0
-
2-1
18-11 | 0.621
-
2-1
-
1-1
-
-
2-1
3-0
2-1
1-2
-
2-1
1-2
2-1
2-1
-
17-11 | 0.607
-
-
1-1
-
3-0
2-1
1-2
-
0-2
2-1
-
2-1
1-2
-
2-1
3-0
18-12 | 0.600
2-1
1-2
-
0-3
-
-
1-2
2-1
-
2-1
2-1
-
2-1
-
3-0
3-0
16-11 | 0.593
2-1
-
-
1-2
-
-
0-3
-
3-0
-
-
2-1
3-0
1-2
2-1
2-1
17-13 | 0.567
1-2
-
1-2
2-1
2-1
3-0
-
-
1-2
-
-
2-1
0-3
-
3-0
2-1
16-14 | 0.533
-
2-1
0-3
-
1-2
-
-
-
3-0
2-1
3-0
0-3
2-1
1-2
2-1
-
15-14 | 0.517
3-0
1-2
1-2
2-0
-
0-3
2-1
0-3
-
-
1-2
-
-
3-0
2-1
-
15-15 | 0.500
1-2
2-1
2-1
1-2
1-2
-
-
1-2
-
-
1-2
1-2
-
3-0
-
2-1
14-16 | 0.467
0-3
1-2
-
-
1-2
-
-
0-3
2-1
2-1
-
1-2
3-0
1-2
-
3-0
12-18 | 0.400
1-2
0-3
1-2
1-2
-
1-2
1-2
3-0
-
2-1
2-1
-
-
-
0-3
-
11-19 | 0.367
-
0-3
1-2
-
-
2-1
-
2-1
0-3
0-3
2-1
-
1-2
-
2-1
1-2
11-19 | 0.367
0-3
-
2-1
2-1
1-2
0-3
3-0
1-2
-
-
0-3
-
-
2-1
-
0-3
10-20 | 0.333
1-2
-
1-2
1-2
0-3
1-2
0-3
1-2
1-2
-
-
3-0
-
1-2
-
-
9-21 | 0.300
0-3
1-2
-
0-3
0-3
1-2
1-2
-
-
1-2
0-3
-
3-0
2-1
-
-
Data via baseballR, stats.ncaa.org | theme via {gtUtils}
Read the data left to right to see each team's record against other league opponents, plus overall league record and win percentage. Table by Chris at Bless your chart | data from May 17
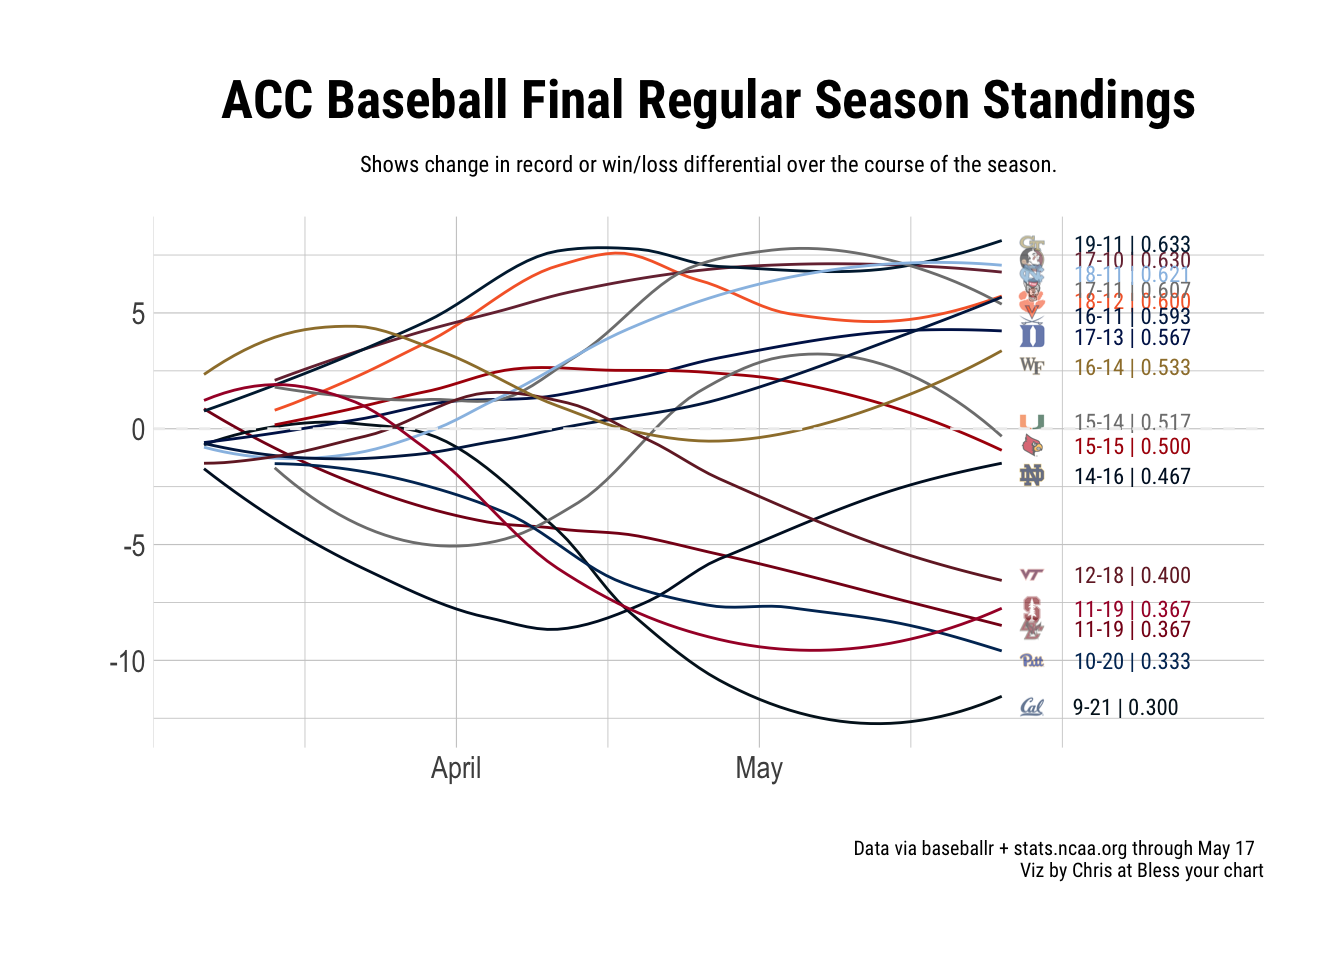
ACC baseball over time
Code
acc_plot_data <- acc_results_long |> dplyr::arrange(team, date) |> dplyr::mutate(win =as.integer(team_score > opp_score),loss =as.integer(team_score < opp_score) ) |> dplyr::group_by(team) |> dplyr::mutate(cum_win =cumsum(win),cum_loss =cumsum(loss),win_diff = cum_win - cum_loss,cum_games = cum_win + cum_loss,cum_win_pct = cum_win / cum_games ) |> dplyr::ungroup()target_date <-as.Date("2025-05-20")team_labels <- acc_plot_data |> dplyr::arrange(desc(date), -contest_id) |> dplyr::group_by(team) |> dplyr::slice_max(order_by = date, n =1) |> dplyr::left_join(standings, by =c("team")) |> dplyr::ungroup() |> dplyr::group_by(cum_win_pct) |> dplyr::mutate(stagger = dplyr::row_number() - (dplyr::n() +1) /2,y_staggered = win_diff + stagger *0.45 ) |> dplyr::ungroup() |> dplyr::mutate(y_staggered = dplyr::case_when( team =="Florida St."~ y_staggered +0.3, team =="North Carolina"~ y_staggered -0.3, team =="Clemson"~ y_staggered -0.45, team =="Virginia"~ y_staggered -0.1, team =="Wake Forest"~ y_staggered +0.7, team =="Miami (FL)"~ y_staggered -0.7, team =="Louisville"~ y_staggered -0.7, team =="Virginia Tech"~ y_staggered -0.3, team =="Boston College"~ y_staggered -0.4,TRUE~ y_staggered ) ) |> dplyr::distinct(team, .keep_all =TRUE)extension_date <-as.Date("2025-05-25")extend_rows <- acc_plot_data |> dplyr::group_by(team) |> dplyr::filter(date ==max(date)) |> dplyr::mutate(date = extension_date) |> dplyr::ungroup()acc_plot_data_extend <- dplyr::bind_rows(acc_plot_data, extend_rows)ggplot2::ggplot(acc_plot_data_extend, ggplot2::aes(x = date, y = win_diff, color = team)) + ggplot2::geom_smooth(linewidth =0.5, se =FALSE) + ggplot2::geom_text(data = team_labels, ggplot2::aes(x =as.Date("2025-05-31"), y = y_staggered, label = record_diff),hjust =-0.1,size =3,show.legend =FALSE,family ="Roboto Condensed" ) + ggplot2::scale_x_date(limits =c(as.Date("2025-03-07"), as.Date("2025-06-15")),breaks =as.Date(c("2025-04-01", "2025-05-01")),labels =function(x) format(x, "%B") # Full month name (e.g., "April") ) + ggplot2::expand_limits(x = target_date +5) + cbbplotR::scale_color_cbb_teams() + cbbplotR::geom_cbb_teams(data = team_labels, ggplot2::aes(x =as.Date("2025-05-28"), y = y_staggered, team = team),width =0.025,alpha =0.6, color =NA, ) + ggplot2::labs(title ="ACC Baseball Final Regular Season Standings",subtitle ="Shows change in record or win/loss differential over the course of the season.",x ="",y ="",caption ="Data via baseballr + stats.ncaa.org through May 17 \nViz by Chris at Bless your chart" ) + ggplot2::geom_hline(yintercept =0, linetype ="dashed", color ="#eeeeee") + hrbrthemes::theme_ipsum() + ggplot2::theme(plot.title = ggtext::element_markdown(hjust =0.5,size =20,family ="Roboto Condensed" ),plot.subtitle = ggtext::element_markdown(hjust =0.5,size =8.5,lineheight =1.5,family ="Roboto Condensed" ),legend.position ="none",#xis.text.x = ggplot2::element_blank(),axis.title.x = ggplot2::element_text(family ="Roboto Condensed"),axis.title.y = ggplot2::element_text(family ="Roboto Condensed"),plot.caption = ggplot2::element_text(face ="plain", size =7.5, "Roboto Condensed") ) -> acc_b_plotggplot2::ggsave("acc_b_plot.png", acc_b_plot,h =8,w =9.5,dpi =600,bg ="white",type ='cairo')acc_b_plot


 Georgia Tech
 Florida St.
 North Carolina
 North Carolina St.
 Clemson
 Virginia
 Duke
Duke Wake Forest
 Miami FL
 Louisville
 Notre Dame
 Virginia Tech
 Stanford
 Boston College
 Pittsburgh
 California