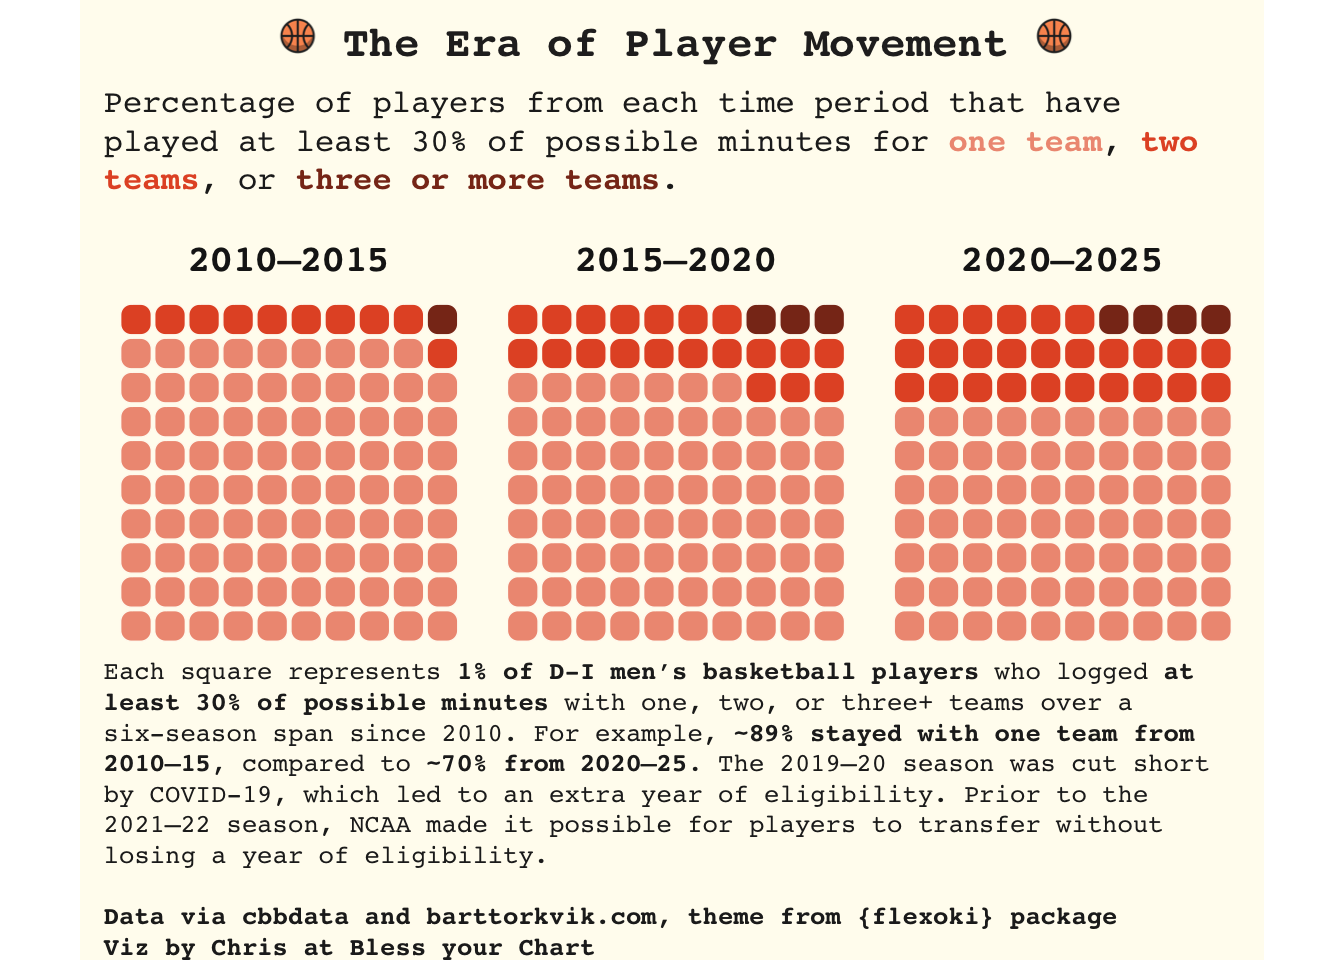
pmove_plot <- pcounts |> dplyr::mutate(pct =round(percentage),pct = dplyr::if_else(pct ==19, 20, pct) ) |> ggplot2::ggplot(ggplot2::aes(fill = team_bucket, values = pct)) + waffle::geom_waffle(color ="floral white", size =0.25, n_rows =10, flip =TRUE, radius = ggplot2::unit(4, "pt"), height =0.9, width =0.9 ) + ggplot2::facet_wrap(~periods, nrow =1, strip.position ="top") + ggplot2::scale_fill_manual(values =c("3+"="#89341c","2"="#e4572e","1"="#ef9a82" ) ) + ggplot2::coord_equal() + ggplot2::labs(title ="<img src='https://a.espncdn.com/combiner/i?img=/redesign/assets/img/icons/ESPN-icon-basketball.png' width='15'/> The Era of Player Movement <img src='https://a.espncdn.com/combiner/i?img=/redesign/assets/img/icons/ESPN-icon-basketball.png' width='15'/>",subtitle ="Percentage of players from each time period that have played at least 30% of possible minutes for <span style='color:#ef9a82;'><b>one team</b></span>, <span style='color:#e4572e;'><b>two teams</b></span>, or <span style='color:#89341c;'><b>three or more teams</b></span>.<br>",caption ="Each square represents **1% of D-I men's basketball players** who logged **at least 30% of possible minutes** with one, two, or three+ teams over a six-season span since 2010. For example, **~89% stayed with one team from 2010–15**, compared to **~70% from 2020–25**. The 2019–20 season was cut short by COVID-19, which led to an extra year of eligibility. Prior to the 2021–22 season, NCAA made it possible for players to transfer without losing a year of eligibility.<br> <br> **Data via cbbdata and barttorkvik.com, theme from {flexoki} package <br>Viz by Chris at Bless your Chart**" ) + flexoki::theme_flexoki_light() + ggplot2::theme(legend.position ="none",plot.title = ggtext::element_markdown(hjust =0.5, size =16),plot.subtitle = ggtext::element_textbox_simple(color ="#222222", margin = ggplot2:::margin(t =5)),plot.caption = ggtext::element_textbox_simple(color ="#222222", margin = ggplot2:::margin(t =5)),axis.text.x = ggplot2::element_blank(),axis.text.y = ggplot2::element_blank(),panel.grid.minor = ggplot2::element_blank(),panel.grid.major = ggplot2::element_blank(),axis.ticks.x = ggplot2::element_blank(),axis.ticks = ggplot2::element_blank(),strip.text = ggplot2::element_text(size =14, face ="bold") )ggplot2::ggsave("movement_plot.png", pmove_plot,w =9,h =6.5,dpi =600,type ='cairo')pmove_plot