distro_plot <- cadeau_fouls |> dplyr::mutate(minute_bin = game_seconds %/%300) |> dplyr::count(minute_bin) |> ggplot2::ggplot(ggplot2::aes(x = minute_bin *5, y = n)) + ggplot2::geom_col(fill ="#56a0d3", color ="white") + hrbrthemes::theme_ipsum() + ggplot2::geom_text( ggplot2::aes(label = n),vjust =-0.5,size =4,family ="Roboto Condensed",color ="gray20" ) + ggplot2::scale_x_continuous(breaks =seq(0, 45, by =5),labels =c("First 5 mins","5-9 min","10-15 min","15-20 min","20-25 min","25-30 min","30-35 min","35-40 min","Overtime","" ) ) + ggplot2::scale_y_continuous(limits =c(0, 20), breaks =seq(0, 20, 5)) + ggplot2::labs(title ="When is Elliot Cadeau whistled for fouls?",subtitle ="Shows total fouls committed in each five-minute segment of game time. \nCadeau has committed a team-high 84 fouls this season.",x ="",y ="Foul Count",caption ="Data via bigballR through February 19, 2025 games \nViz by Chris at Bless your Chart" ) + ggplot2::theme(plot.subtitle = ggtext::element_markdown(),plot.caption = ggtext::element_markdown(face ="plain"),panel.grid.major = ggplot2::element_blank() )ggplot2::ggsave("ec_plot.png", distro_plot,w =8.5,h =7.5,dpi =600,type ='cairo',bg ="white")distro_plot
Fouls table
Code
ctbl <- cadeau_fouls |> dplyr::group_by(game_id, opponent) |> dplyr::arrange(game_seconds, .by_group =TRUE) |> dplyr::mutate(foul_number = dplyr::row_number()) |> dplyr::filter(foul_number <=5) |> dplyr::select(game_id, opponent, foul_number, game_seconds) |> tidyr::pivot_wider(names_from = foul_number,values_from = game_seconds,names_prefix ="Foul_") |> dplyr::ungroup() |> dplyr::mutate(game_id =as.numeric(game_id)) |> dplyr::mutate(row_number = dplyr::case_match( game_id,5722933~1,5810067~2,5722945~3,5730381~4,5722959~5,5810062~6,5810055~7,5722389~8,5732549~9,5722995~10,5723013~11,5723033~12,5723044~13,5732557~14,5732566~15,5732572~16,5732517~17,5732590~18,5732592~19,5732601~20,5732390~21,5732607~22,5732612~23,5732616~24,5732625~25,5732624~26,5732578~27 ) ) |> dplyr::arrange(row_number) |> cbbplotR::gt_cbb_teams(opponent, opponent,include_name =TRUE,logo_height =20) |> gt::gt() |> gt::cols_hide(columns =c(row_number, game_id)) |> gt::fmt_markdown(opponent) |> gt::cols_label(opponent ="",Foul_1 ="1",Foul_2 ="2",Foul_3 ="3",Foul_4 ="4",Foul_5 ="5" ) |> gt::tab_spanner(columns =starts_with("Foul_"), label ="Time of game when each foul was committed") |> gt::fmt_missing(columns = gt::everything(), missing_text ="-") |> gt::fmt(columns = dplyr::starts_with("Foul_"),fns =function(x)ifelse(is.na(x), "-", sprintf("%d:%02d", x %/%60, x %%60)) ) |> gt::tab_header(title ="When is Elliot Cadeau whistled for fouls?",subtitle = gt::md("Shows timestamps of game time when Cadeau is charged with a foul. \nHighlights any fouls committed in the first five minutes." ) ) |> gt::tab_source_note(source_note = gt::html("Shows timestamp of game, counting up to 40+ minutes, when the foul was committed. <br>Data through February 19, 2025 games<br><b>Table by Chris at Bless your chart | data via bigballR + stats.ncaa.org</b>" ) ) |> gt::cols_align(align ="left") |> gtExtras::gt_theme_dot_matrix() |> gt::tab_options (source_notes.font.size = gt::px(10),row.striping.background_color ='#EEEEEE',table.font.size = gt::px(10),column_labels.text_transform ='uppercase', ) |> gt::tab_style(style =list(gt::cell_fill(color ="#FFC1C3")),locations = gt::cells_body(columns =c("Foul_1"),rows =c(4, 5, 7, 11, 16, 18, 20, 22, 27) ) ) |> gt::tab_style(style =list(gt::cell_fill(color ="#FFC1C3")),locations = gt::cells_body(columns =c("Foul_2"), rows =c(4, 7, 16)) ) |> gtUtils::gt_border_grid(color ="black",weight =0.5,include_labels =FALSE) |> gt::tab_style(locations = gt::cells_column_spanners(),style = gt::cell_text(transform ="capitalize") ) |> gtUtils::gt_border_bars_bottom(c("#56a0d3", "#89BDE0", "#BBD9ED"))gtUtils::gt_save_crop(ctbl,file ="c_tbl.png",whitespace =40,bg ="white")ctbl
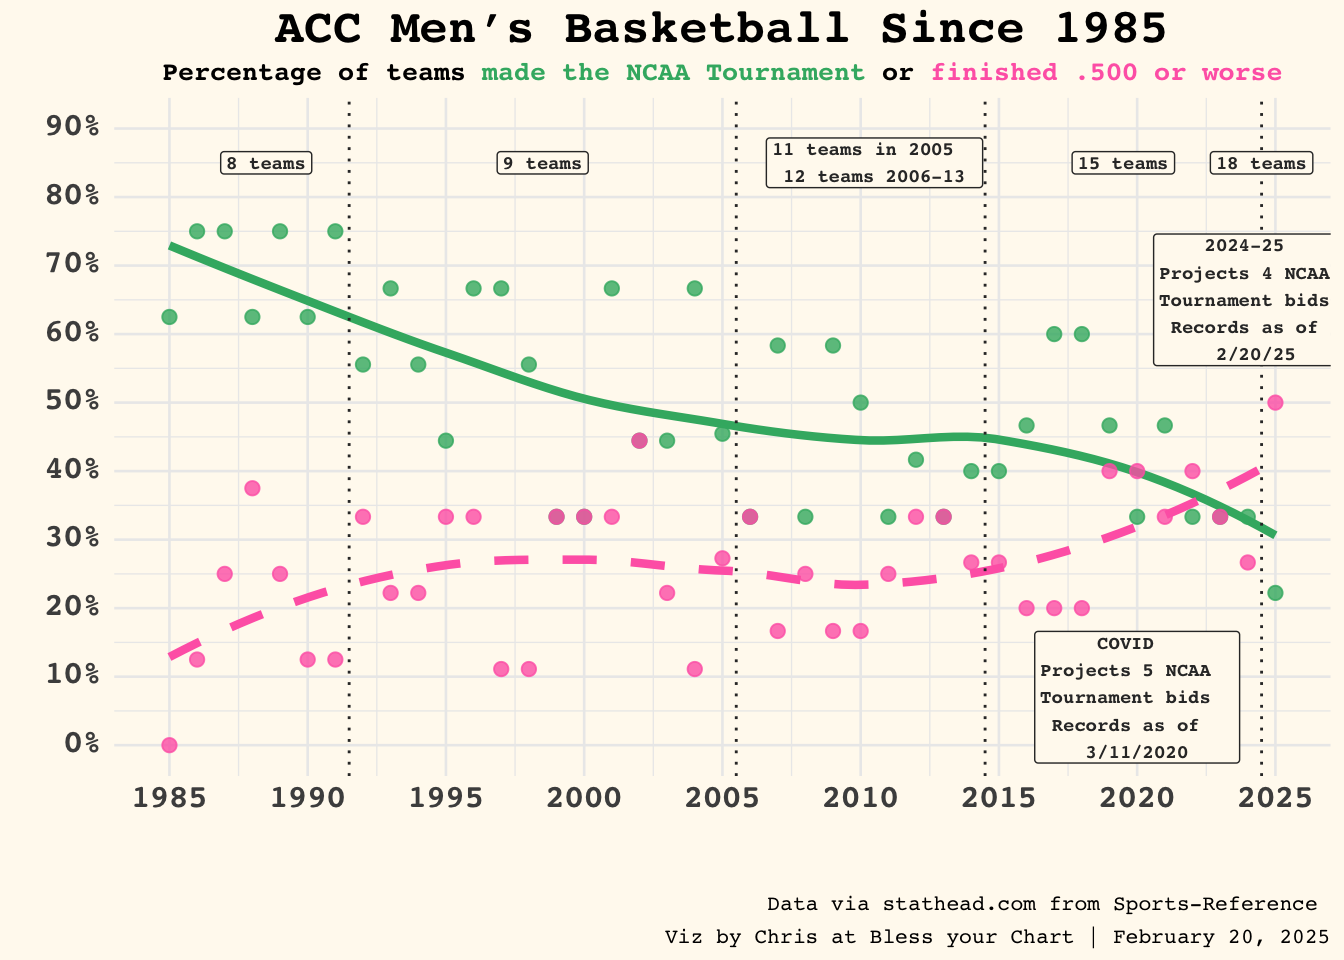
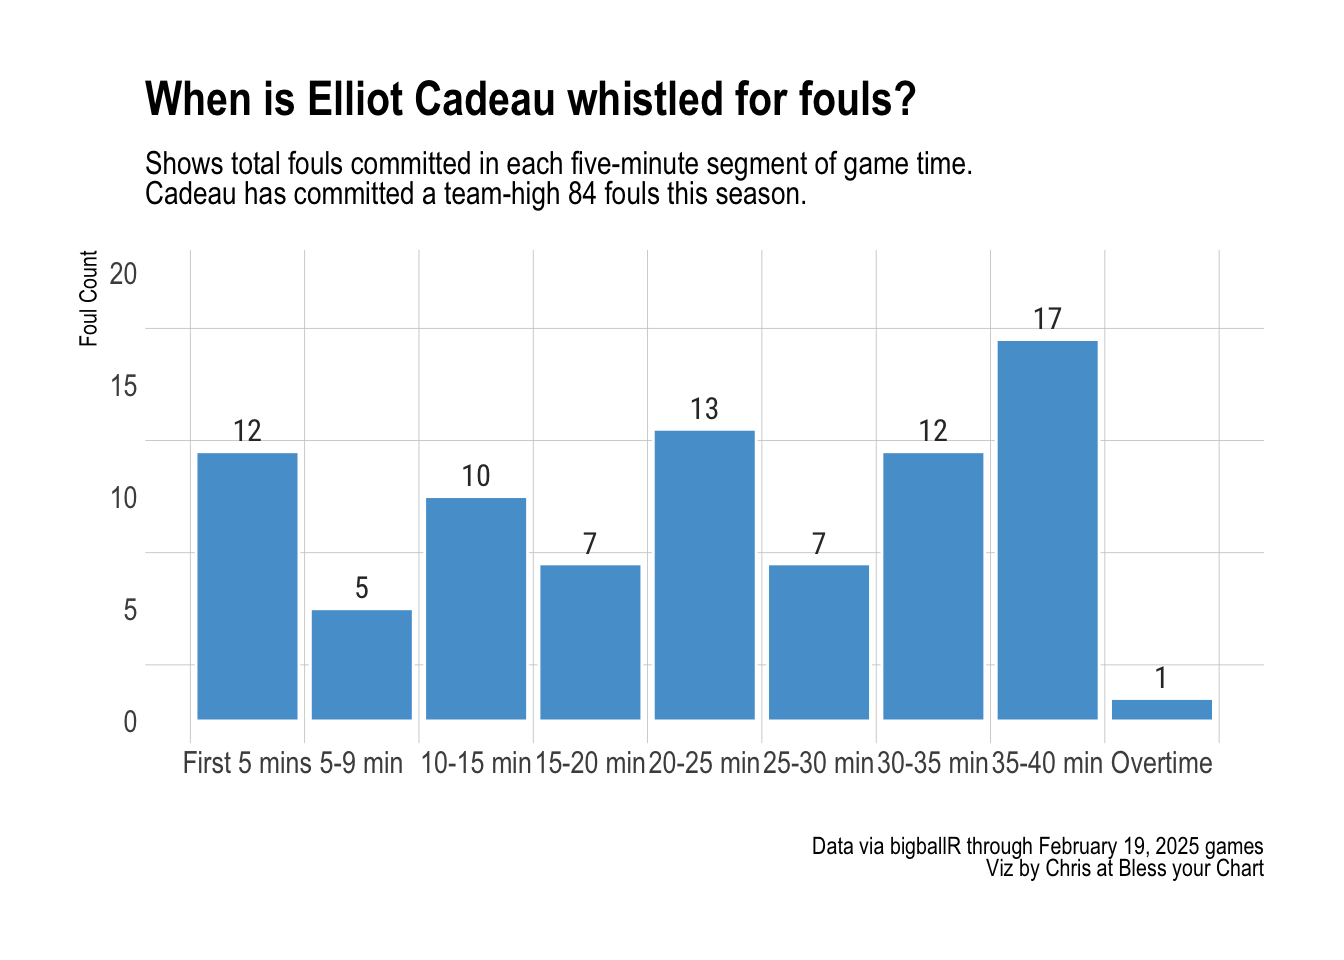
When is Elliot Cadeau whistled for fouls?
Shows timestamps of game time when Cadeau is charged with a foul.
Highlights any fouls committed in the first five minutes.
Time of game when each foul was committed
1
2
3
4
5
Elon
22:42
-
-
-
-
Kansas
19:12
22:46
37:44
-
-
American
8:43
23:23
-
-
-
Hawaii
1:07
3:22
-
-
-
Dayton
1:39
17:32
22:14
23:06
-
Auburn
13:41
22:20
38:14
38:38
-
Michigan St.
1:14
2:21
26:44
38:36
44:52
Alabama
13:56
25:18
-
-
-
Georgia Tech
27:32
33:39
-
-
-
La Salle
8:58
12:54
30:23
-
-
Florida
0:34
29:20
35:21
39:53
-
UCLA
31:25
31:42
34:32
-
-
Campbell
5:28
33:56
35:50
-
-
Louisville
8:37
17:56
25:18
28:18
38:49
Notre Dame
16:26
19:57
24:53
35:10
-
SMU
2:56
3:57
24:32
32:14
-
North Carolina St.
33:39
34:41
-
-
-
California
4:04
18:43
22:05
-
-
Stanford
5:58
12:39
35:50
-
-
Wake Forest
2:18
34:16
38:43
39:49
-
Boston College
39:57
-
-
-
-
Pittsburgh
3:00
15:44
23:24
32:22
39:49
Duke
14:30
38:17
-
-
-
Pittsburgh
10:47
11:13
25:33
-
-
Clemson
21:05
30:32
-
-
-
Syracuse
12:29
13:37
23:33
36:08
-
North Carolina St.
2:54
13:41
22:41
38:53
-
Shows timestamp of game, counting up to 40+ minutes, when the foul was committed.
Data through February 19, 2025 games Table by Chris at Bless your chart | data via bigballR + stats.ncaa.org
 Elon
Elon Kansas
 American
 Hawaii
 Dayton
 Auburn
 Michigan St.
 Alabama
 Georgia Tech
 La Salle
 Florida
 UCLA
UCLA Campbell
 Louisville
 Notre Dame
 SMU
SMU North Carolina St.
 California
 Stanford
 Wake Forest
 Boston College
 Pittsburgh
 Duke
Duke Clemson
 Syracuse