base_plot <- cfb_ranks |>
  dplyr::mutate(conf = factor(conf,
                              levels = c("SEC", "Independents", "Mountain West",
                                         "Big 12","American", "Big Ten", "ACC"))) |>
  ggplot2::ggplot(ggplot2::aes(x = conf, y = cfp_rank, group = conf)) +
  cfbplotR::geom_cfb_logos(ggplot2::aes(team = team_name),
                           width = 0.035,
                           position = ggplot2::position_jitter(width = 0,
                                                               height = 0.55,
                                                               seed = 124)) +
  ggplot2::scale_y_reverse() +
  ggthemes::theme_fivethirtyeight() +
  ggplot2::labs(
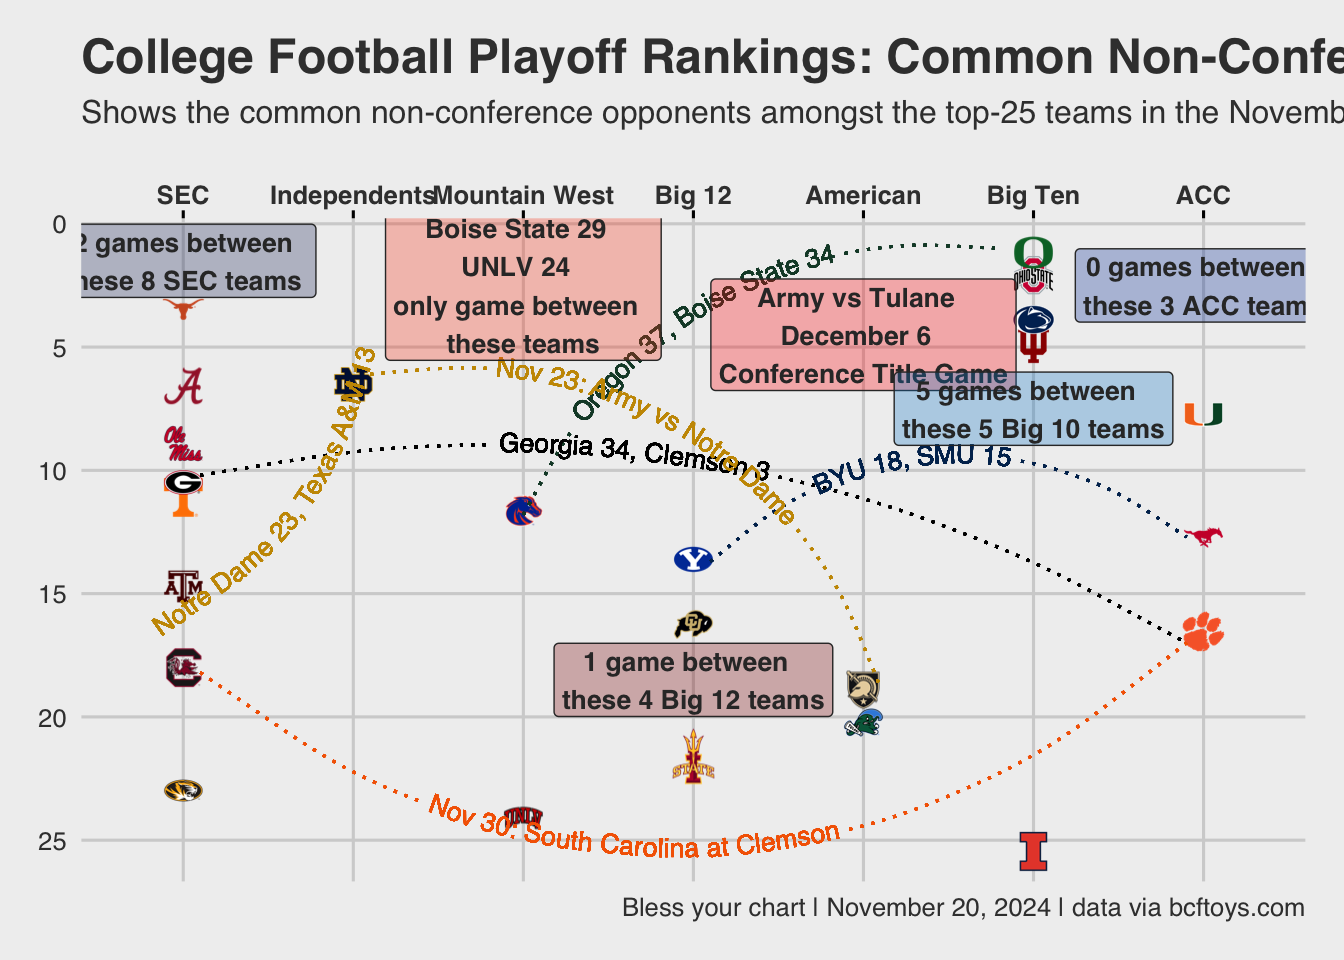
    title = "College Football Playoff Rankings: Common Non-Conference Opponents",
    subtitle = "Shows the common non-conference opponents amongst the top-25 teams in the November 19 playoff rankings.  \n",
    caption = "Bless your chart | November 20, 2024 | data via bcftoys.com",
    x = "Playoff Ranking",
    y = ""
  ) +
  ggplot2::theme(
    axis.text.x = ggplot2::element_text(face = "bold"),
    axis.text.x.bottom = ggplot2::element_blank(),
    axis.text.x.top = ggplot2::element_text(face = "bold"),
    axis.ticks.x.top = ggplot2::element_line(),
    axis.title.x.top = ggplot2::element_blank(),
    plot.title = ggtext::element_markdown()
  ) +
  ggplot2::scale_x_discrete(position = "top")

text_plot <- base_plot +
  geomtextpath::geom_textcurve(ggplot2::aes(x = 3, y = 11.8, xend = 5.8, yend = 1),
                hjust = 0.4, color = "#154733", linetype = "dotted",
                 curvature = -0.35, size = 3.5, label = oregon_boise,
                family = 'sans') +
  geomtextpath::geom_textcurve(ggplot2::aes(x = 1.1, y = 10.2, xend = 6.9, yend = 17),
                               hjust = 0.4, color = "#000000", linetype = "dotted",
                               curvature = -0.2, size = 3.5, label = clem_uga,
                               family = 'sans') +
  geomtextpath::geom_textcurve(ggplot2::aes(x = 1.1, y = 18.2, xend = 6.9, yend = 17),
                               hjust = 0.4, color = "#F56600", linetype = "dotted",
                               curvature = 0.4, size = 3.5, label = sc_clem,
                               family = 'sans') +
  geomtextpath::geom_textcurve(ggplot2::aes(x = 4.1, y = 13.7, xend = 6.9, yend = 12.7),
                               hjust = 0.4, color = "#002E5D", linetype = "dotted",
                               curvature = -0.4, size = 3.5, label = smu_byu,
                               family = 'sans') +
  geomtextpath::geom_textcurve(ggplot2::aes(x = 2.1, y = 6.1, xend = 5.1, yend = 18.8),
                               hjust = 0.4, color = "#C99700", linetype = "dotted",
                               curvature = -0.4, size = 3.5, label = nd_army,
                               family = 'sans') +
  geomtextpath::geom_textcurve(ggplot2::aes(x = 2, y = 6.4, xend = 1.1, yend = 15),
                               hjust = 0.4, color = "#C99700", linetype = "dotted",
                               curvature = -0.2, size = 3.5, label = tam_nd,
                               family = 'sans') +
  ggplot2::annotate(
    geom = "label",
    x = 1,
    y = 1.5,
    label =  sec_teams,
    fill = "#22356B",
    color = "#333333",
    size = 3.5,
    fontface = 'bold',
    family = 'sans',
    alpha = .3,
    hjust = 0.5
  ) +
  ggplot2::annotate(
    geom = "label",
    x = 3,
    y = 2.5,
    label =  "Boise State 29  \nUNLV 24  \nonly game between  \nthese teams",
    fill = "#FA4616",
    color = "#333333",
    size = 3.5,
    fontface = 'bold',
    family = 'sans',
    alpha = .3,
    hjust = 0.5
  ) +
  ggplot2::annotate(
    geom = "label",
    x = 4,
    y = 18.5,
    label =  big_12_teams,
    fill = "darkred",
    color = "#333333",
    size = 3.5,
    fontface = 'bold',
    family = 'sans',
    alpha = .3,
    hjust = 0.5
  ) +
  ggplot2::annotate(
    geom = "label",
    x = 5,
    y = 4.5,
    label =  "Army vs Tulane  \nDecember 6  \nConference Title Game",
    fill = "red",
    color = "#333333",
    size = 3.5,
    fontface = 'bold',
    family = 'sans',
    alpha = .3,
    hjust = 0.5
  ) +
  ggplot2::annotate(
    geom = "label",
    x = 6,
    y = 7.5,
    label =  big_ten_teams,
    fill = "#0088CE",
    color = "#333333",
    size = 3.5,
    fontface = 'bold',
    family = 'sans',
    alpha = .3,
    hjust = 0.5
  ) +
  ggplot2::annotate(
    geom = "label",
    x = 7,
    y = 2.5,
    label =  acc_teams,
    fill = "#013CA6",
    color = "#333333",
    size = 3.5,
    fontface = 'bold',
    family = 'sans',
    alpha = .3,
    hjust = 0.5
  )

ggplot2::ggsave(
  "text_plot.png",
  text_plot,
  w = 10.5,
  h = 8.5,
  dpi = 600,
  type = 'cairo'
)

text_plot


