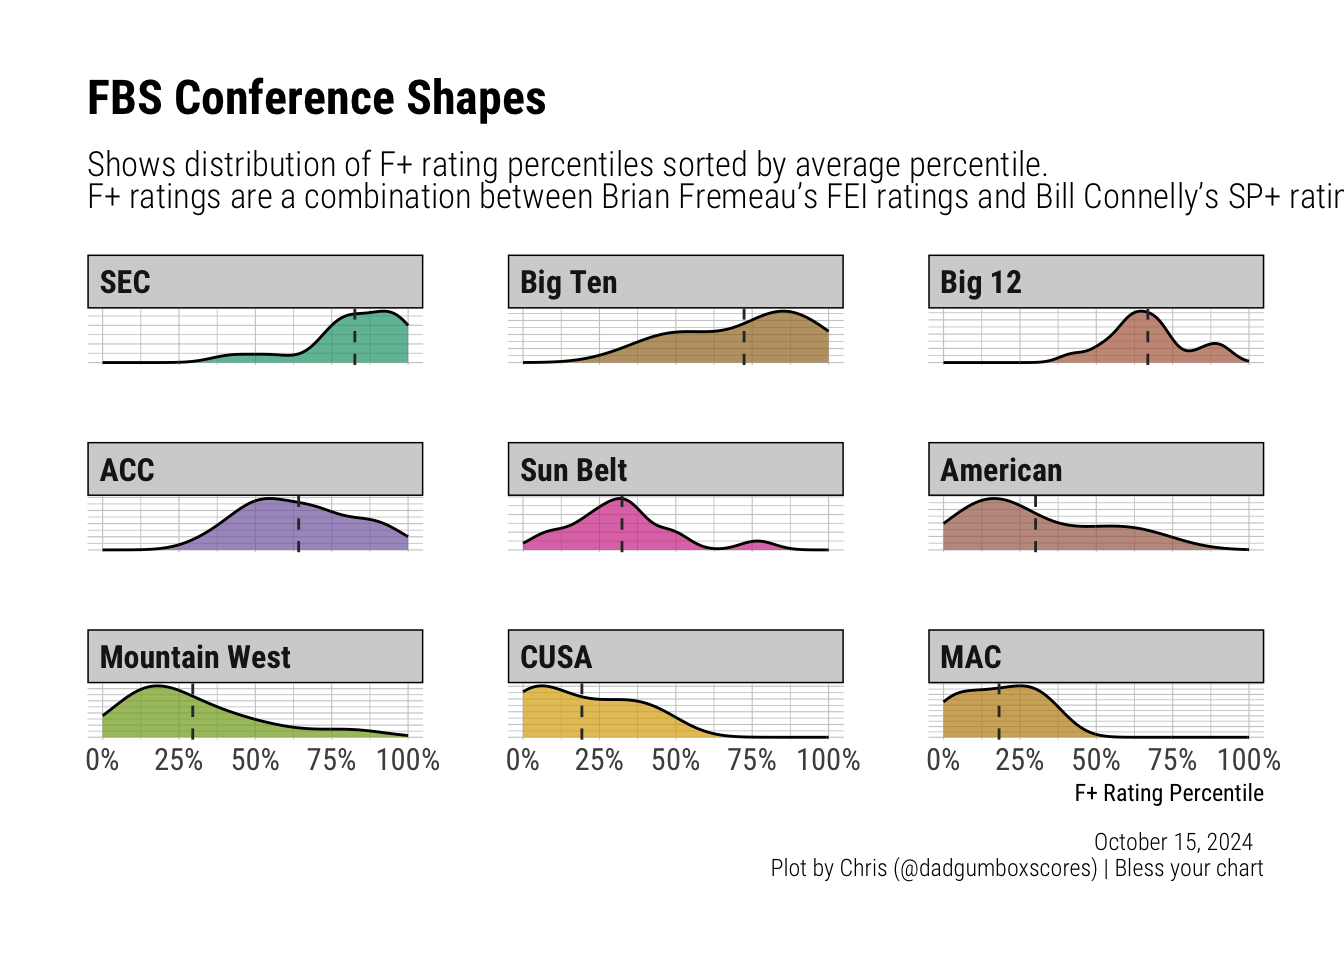
conf_density <- cfb_ratings |>
  dplyr::filter(!conf %in% c("Pac-2", "Independents")) |>
  dplyr::mutate(conf = forcats::fct_relevel(conf, conf_order)) |>
  ggplot2::ggplot(ggplot2::aes(x = f_plus_ptile, fill = conf)) +
  ggplot2::geom_density(alpha = 0.7) +
  ggplot2::facet_wrap(~ conf, scales = "free_y") +
  ggplot2::geom_vline(data = conf_stats, ggplot2::aes(xintercept = mean_f_plus_ptile),
                      linetype = "dashed", color = "#333333") +
  ggplot2::geom_label(data = conf_stats,
                     ggplot2::aes(x = mean_f_plus_ptile, y = Inf,
                                  label = sprintf("%.0f%%", mean_f_plus_ptile * 100)),
                     hjust = -0.1, vjust = 3, fill = "floral white", color = "#333333", size = 4) +
  hrbrthemes::theme_ipsum_rc() +
  ggplot2::labs(
    title = "FBS Conference Shapes",
    subtitle = "Shows distribution of F+ rating percentiles sorted by average percentile. <br>F+ ratings are a combination between Brian Fremeau's FEI ratings and Bill Connelly's SP+ ratings.",
    x = "F+ Rating Percentile",
    y = "",
    caption = "October 15, 2024  \nPlot by Chris (@dadgumboxscores) | Bless your chart",
    x = "",
  ) +
  ggplot2::theme(
    legend.position = "none",
    strip.background = ggplot2::element_rect(fill = "lightgray"),
    strip.text = ggplot2::element_text(face = "bold"),
    axis.text.y = ggplot2::element_blank(),
    axis.title.y = ggplot2::element_blank(),
    plot.subtitle = ggtext::element_markdown()
  ) +
  ggplot2::scale_fill_manual(values =
                               colorRampPalette(RColorBrewer::brewer.pal(8, "Dark2"))(
                                 length(unique(cfb_ratings$conf)))) +
  ggplot2::scale_x_continuous(labels = scales::percent_format(accuracy = 1))


 ggplot2::ggsave(
    "conf_density_plot.png",
    conf_density,
    w = 10.5,
    h = 8.5,
    dpi = 600,
    type = 'cairo'
  )

conf_density
