efg_plot <- unc_facts |>
ggplot2::ggplot(ggplot2::aes(x = type, y = off_efg)) +
ggthemes::geom_tufteboxplot() +
ggplot2::geom_hline(yintercept = 50, linetype = "dashed") +
ggplot2::coord_flip() +
ggthemes::theme_clean() +
ggplot2::scale_x_discrete(labels = c("Conference", "Non-Conference")) +
ggplot2::theme(legend.position = "none",
plot.title = ggtext::element_markdown()) +
ggplot2::labs(x = "",
y = "Effective Field Goal %",
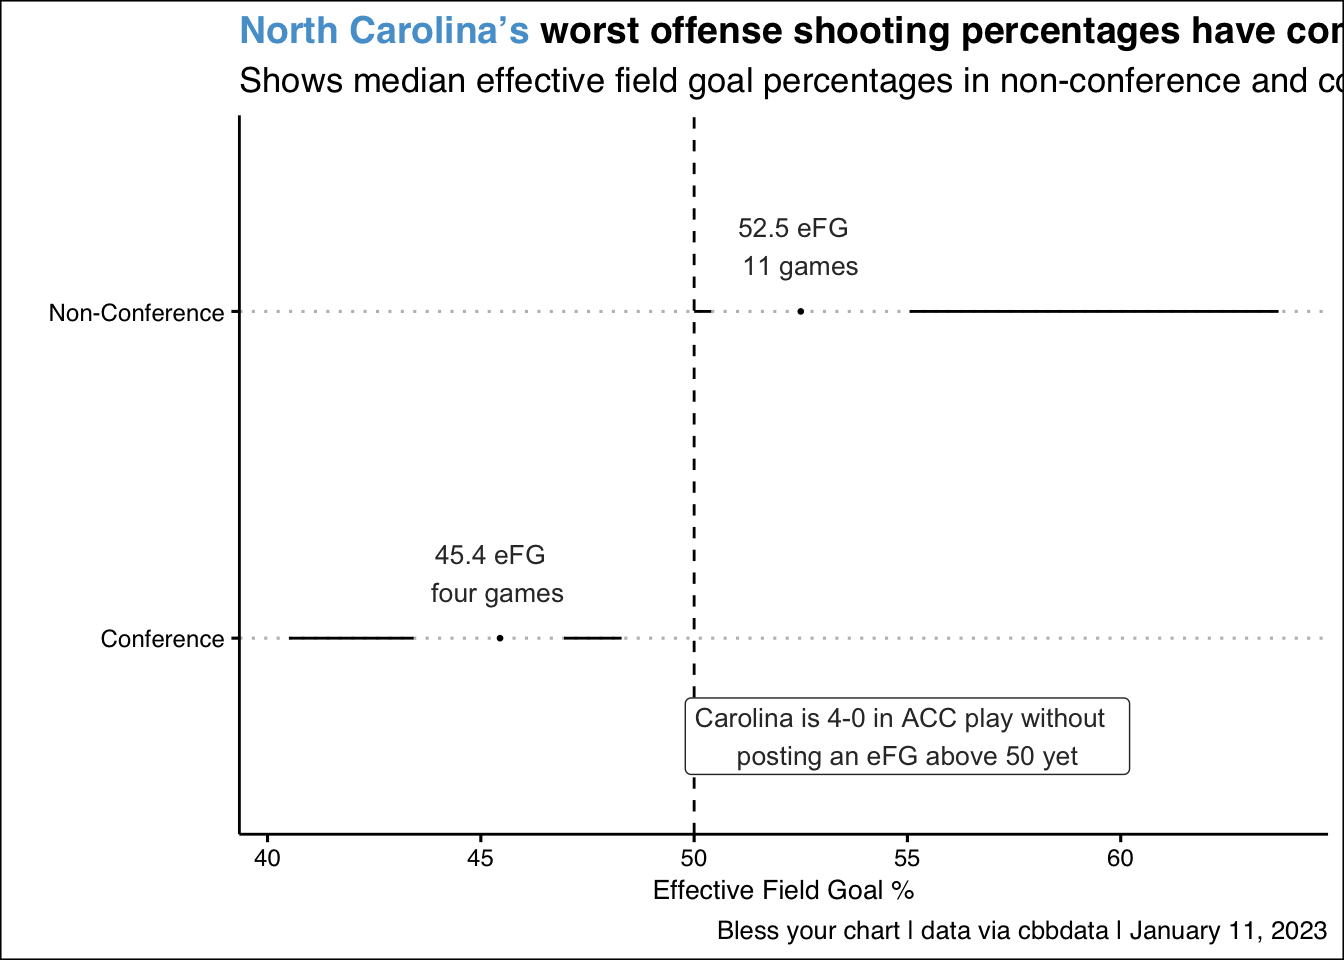
title = "<span style='color:#56a0d3;'>North Carolina's</span> worst offense shooting percentages have come in ACC play so far",
subtitle = "Shows median effective field goal percentages in non-conference and conference games this season.",
caption = "Bless your chart | data via cbbdata | January 11, 2023"
) +
ggplot2::annotate(
"label",
x = 0.7,
y = 55,
label = "Carolina is 4-0 in ACC play without \nposting an eFG above 50 yet",
size = 3.5,
color = "#333333",
fill = "white"
) +
ggplot2::annotate(
"text",
x = 1.2,
y = 45.4,
label = "45.4 eFG \nfour games",
size = 3.5,
color = "#333333",
) +
ggplot2::annotate(
"text",
x = 2.2,
y = 52.5,
label = "52.5 eFG \n11 games",
size = 3.5,
color = "#333333",
) -> efg_plot
ggplot2::ggsave(
"efg_plot.png",
efg_plot,
w = 10,
h = 6,
dpi = 600,
type = 'cairo'
)
efg_plot