theme_me <- function() {
# Create a base theme with minimal style
base_theme <- ggplot2::theme_minimal(base_size = 10, base_family = "RobotoCondensed-Regular")
# Customize the base theme with additional modifications
custom_theme <- base_theme +
ggplot2::theme(
plot.title = ggplot2::element_text(
hjust = 0.5,
size = 24,
face = "bold"
),
plot.subtitle = ggplot2::element_text(
hjust = 0.5,
size = 10,
),
plot.caption = ggplot2::element_text(
hjust = 0.5,
size = 6,
lineheight = 0.35,
margin = ggplot2::margin(t = 0.5)
),
plot.background = ggplot2::element_rect(fill = "floralwhite", color = "floralwhite")
)
return(custom_theme)
}
fball |>
dplyr::group_by(Year) |>
dplyr::mutate(game_no = dplyr::row_number()) |>
dplyr::ungroup() |>
ggplot2::ggplot(ggplot2::aes(x = Year, y = DPD, label = rk)) +
ggplot2::geom_point(shape = 1, color = "#acacac", size = 2.5) +
ggplot2::geom_smooth(fill = "#acacac", color = "#56a0d3") +
ggplot2::scale_y_continuous(breaks = seq(0, 5, 0.5)) +
ggplot2::scale_x_continuous(breaks = seq(2012, 2023, 1)) +
ggplot2::geom_vline(xintercept = c(2014.5, 2016.5, 2018.5, 2021.5), color = "#333333", linetype = "dashed") +
ggplot2::geom_text(ggplot2::aes(x = Year, y = 5.5, size = 4.5, face ='bold', family = 'mono'), color = "#56a0d3") +
ggplot2::geom_text(ggplot2::aes(x = 2012.5, y = 5.8, label = "FBS Ranking",size = 4.5, face ='bold', family = 'mono'), color = "#56a0d3") +
theme_me() +
ggplot2::theme(legend.position = "none",
plot.title = ggtext::element_markdown(face ='bold', family = 'mono'),
strip.text.x = ggtext::element_markdown(size = 12,
face ='bold', family = 'mono'),
plot.subtitle = ggtext::element_markdown(size = 10, family = "mono"),
plot.caption = ggtext::element_markdown(size = 7, family = 'mono'),
axis.text.x = ggtext::element_markdown(size = 12, family = 'mono', face ='bold'),
axis.text.y = ggtext::element_markdown(size = 12, family = 'mono', face ='bold')
) +
ggplot2::labs(x = "",
y = "",
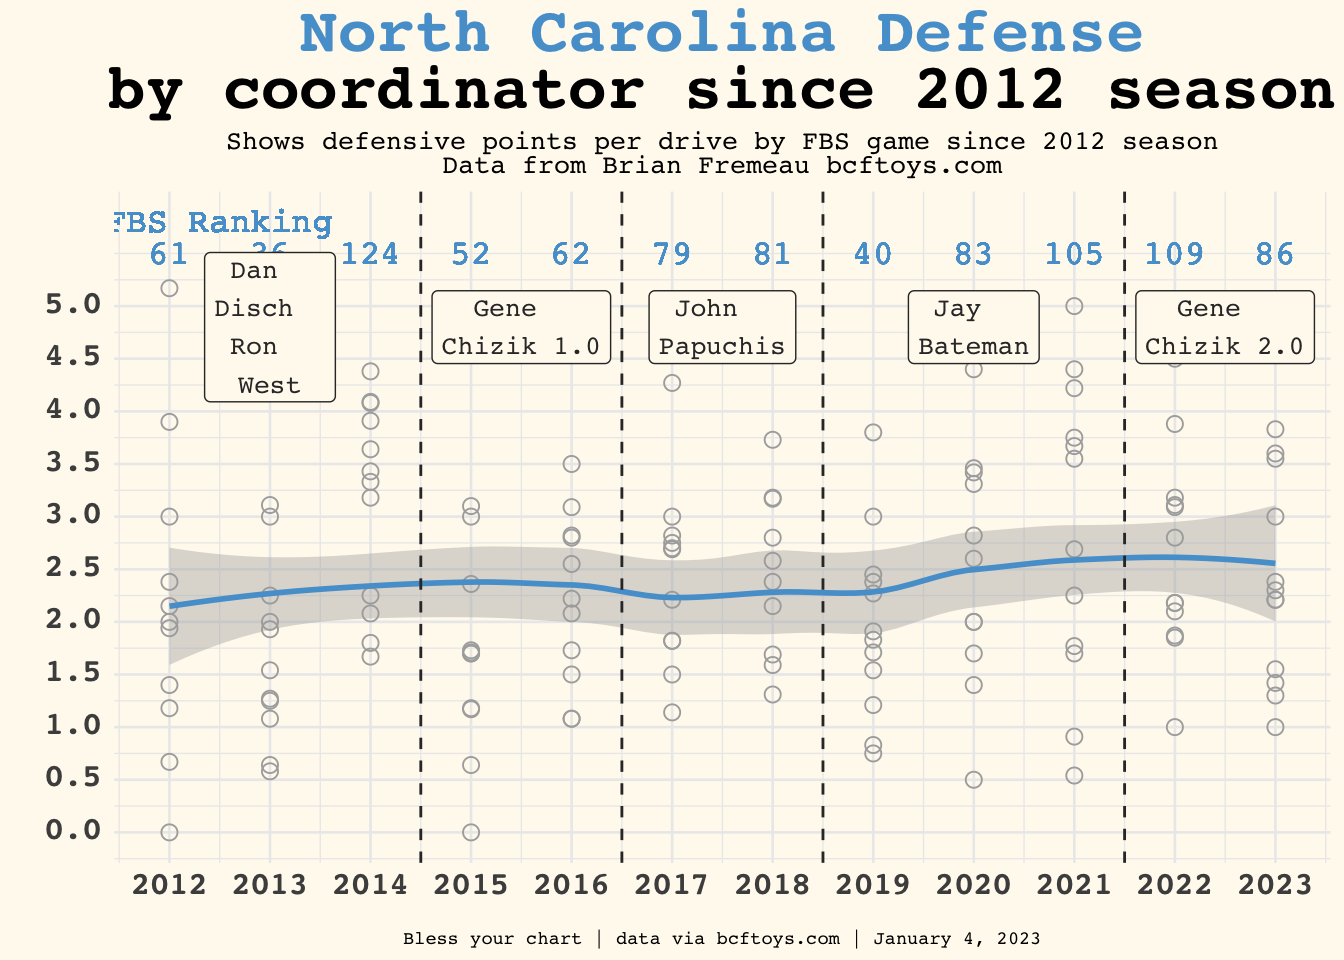
title = "<span style='color:#56a0d3;'>North Carolina Defense</span> \nby coordinator since 2012 season",
subtitle = "Shows defensive points per drive by FBS game since 2012 season \nData from Brian Fremeau bcftoys.com",
caption = "Bless your chart | data via bcftoys.com | January 4, 2023"
) +
ggplot2::annotate(
"label",
x = 2013,
y = 4.8,
label = "Dan \nDisch \nRon \nWest",
family = 'mono',
face ='bold',
size = 3.5,
color = "#333333",
fill = "floral white"
) +
ggplot2::annotate(
"label",
x = 2015.5,
y = 4.8,
label = "Gene \nChizik 1.0",
family = 'mono',
face ='bold',
size = 3.5,
color = "#333333",
fill = "floral white"
) +
ggplot2::annotate(
"label",
x = 2017.5,
y = 4.8,
label = "John \nPapuchis",
family = 'mono',
face ='bold',
size = 3.5,
color = "#333333",
fill = "floral white"
) +
ggplot2::annotate(
"label",
x = 2020,
y = 4.8,
label = "Jay \nBateman",
family = 'mono',
face ='bold',
size = 3.5,
color = "#333333",
fill = "floral white"
) +
ggplot2::annotate(
"label",
x = 2022.5,
y = 4.8,
label = "Gene \nChizik 2.0",
family = 'mono',
face ='bold',
size = 3.5,
color = "#333333",
fill = "floral white"
) -> uncd_plot
uncd_plot