059: State and UNC

gt_table
Published

November 19, 2023

Load data

Code
state <- readr::read_csv("state_unc.csv") |> 
         dplyr::mutate_if(is.character, ~replace(., is.na(.), ""))

state |> 
    dplyr::mutate(diff = UNC - State) |> 
    dplyr::group_by(UNC_Coach) |> 
    dplyr::summarise(start = min(Year),
                     end = max(Year),
                     w = sum(Result == "W"), 
                     l = sum(Result == "L"), 
                     diff = sum(diff)) -> unc_by_coach

state |> 
    dplyr::mutate(diff = State - UNC) |> 
    dplyr::group_by(State_Coach) |> 
    dplyr::summarise(start = min(Year),
                     end = max(Year),
                     w = sum(Result == "L"), 
                     l = sum(Result == "W"), 
                     diff = sum(diff)) -> state_by_coach

table_final <-state |> 
  dplyr::arrange(Year, Result) |> 
  dplyr::mutate(row_no = dplyr::row_number(),
                season_index = ceiling(row_no / 5),
                season_end_year = 2022 - season_index,
                team_index = row_no - (season_index * 5) + 5,
                .before = season_end_year, 
                text_label = dplyr::if_else(Result == "W",
                  paste0(UNC,"-", State, " ", OT, "\n", Year), 
                  paste0(State,"-", UNC, " ", OT, "\n", Year)),
                winner = dplyr::if_else(Result == "W", "North Carolina", "NC State"))

GT Athletic Theme

Code
gt_theme_athletic <- function(gt_object, ...) {
  
  # get id, if one is passed through to use with CSS
  table_id <- subset(gt_object[['_options']], parameter == 'table_id')$value[[1]]
  
  table <- gt_object |> 
    # set table font
    gt::opt_table_font(
      font = list(
        gt::google_font('Spline Sans Mono'),
        gt::default_fonts()
      ),
      weight = 500
    ) |> 
    # set the column label font and style
    gt::tab_style(
      locations = gt::cells_column_labels(
        columns = gt::everything()
      ),
      style = gt::cell_text(
        font = gt::google_font('Work Sans'),
        weight = 650,
        size = gt::px(14),
        transform = 'uppercase', # column labels to uppercase
        align = 'left'
      )
    ) |> 
    gt::tab_style(
      locations = gt::cells_title('title'),
      style = gt::cell_text(
        font = gt::google_font('Work Sans'),
        weight = 650
      )
    ) |> 
    gt::tab_style(
      locations = gt::cells_title('subtitle'),
      style = gt::cell_text(
        font = gt::google_font('Work Sans'),
        weight = 500
      )
    ) |>
    # set think black column sep.
    gt::tab_style(
      style = gt::cell_borders(sides = 'left', weight = gt::px(0.5), color = 'black'),
      locations = gt::cells_body(
        # everything but the first column
        columns = c(-names(gt_object[['_data']])[1])
      )
    ) |> 
    # set thin dotted row sep.
    gt::tab_style(
      style = gt::cell_borders(sides = "top", color = 'black', weight = gt::px(1.5), style = 'dotted'),
      locations = gt::cells_body(
        rows = gt::everything()
      )
    )|>
    # left align cell text
    gt::cols_align(
      align = 'left',
      columns = gt::everything()
    ) |> 
    gt::tab_options(
      table.font.size = 14,
      column_labels.border.bottom.width = 2,
      column_labels.border.bottom.color = 'black',
      column_labels.border.top.color = 'white',
      row_group.border.bottom.color = 'white',
      table.border.top.style = 'none',
      table.border.bottom.style = 'none',
      heading.border.bottom.style = 'none',
      heading.align = 'left',
      heading.title.font.size = gt::px(30),
      source_notes.border.lr.style = 'none',
      source_notes.font.size = 10
    )
  
  # add css if table id is passed through
  table <- if(!is.null(table_id)) {
    table |> 
      # remove the border from the bottom cell
      gt::opt_css(
        paste0("#", table_id, " tbody tr:last-child {border-bottom: 2px solid #ffffff00;}"),
        add = TRUE
      )
  }
  
  return(table)
  
}

# helper function to stack tables
stack_gt_tables <- function (tables = NULL, output = "viewer", filename = NULL,
                             path = NULL, vwidth = 992, vheight = 1200, ..., zoom = 2,
                             expand = 5)
{
  # divs for each table // change style from gt_two_column_layout
  stacked_tables <- htmltools::div(
    htmltools::div(tables[[1]], style = "display: block; width: 100%;"),
    htmltools::div(tables[[2]], style = "display: block; width: 100%;")
  )

  # carry rest of gt_two_column_layout
  if (output == "viewer") {
    htmltools::browsable(stacked_tables)
  }
  else if (output == "save") {

    filename <- if (is.null(filename)) tempfile(fileext = ".png") else filename
    filename <- if (is.null(path)) filename else file.path(path, filename)

    tempfile_ <- tempfile(fileext = ".html")
    htmltools::save_html(html = stacked_tables, file = tempfile_)

    webshot2::webshot(url = paste0("file:///", tempfile_),
                      file = filename, vwidth = vwidth, vheight = vheight,
                      zoom = zoom, expand = expand, ...)

  }
  else if (output == "html") {
    stacked_tables
  }
}

GT Table by coach

Code
state_by_coach |> 
  dplyr::mutate(logo = "NC State") |>
  dplyr::relocate(logo, .before = State_Coach) |>
  dplyr::mutate(end = dplyr::if_else(State_Coach == "Dave Doeren", 2023, end)) |> 
  dplyr::arrange(-start) |> 
  gt::gt() |> 
  gt::cols_label(
    logo = "",
    State_Coach = "Coach",
    start = "",
    end = "",
    w = "W",
    l = "L",
    diff = "+/-"
  ) |> 
    gt::fmt(
    columns = c(diff),
    fns = function(x) {
      ifelse(x > 0, paste0("+", x), x)
    }
  ) |>
  cfbplotR::gt_fmt_cfb_logo(columns = c("logo")) |> 
  gtExtras::gt_highlight_rows(
    rows = c(1),
    fill = "#F9E5E5",
    bold_target_only = TRUE,
    target_col = c(State_Coach),
  ) |> 
  gt::tab_header(title = "NC State Record by Head Coach  \nagainst North Carolina") |>
  gt::tab_source_note(source_note = "Bless your chart | data via cfbfastR + gt athletic theme from @andreweatherman")  |>
  gt_theme_athletic() -> state_table

unc_by_coach |> 
  dplyr::mutate(logo = "North Carolina") |>
  dplyr::relocate(logo, .before = UNC_Coach) |>
  dplyr::mutate(end = dplyr::if_else(UNC_Coach == "Mack Brown 2.0", 2023, end)) |>
  dplyr::arrange(-start) |> 
  gt::gt() |> 
  gt::cols_label(
    logo = "",
    UNC_Coach = "Coach",
    start = "",
    end = "",
    w = "W",
    l = "L",
    diff = "+/-"
  ) |> 
  gt::fmt(
    columns = c(diff),
    fns = function(x) {
      ifelse(x > 0, paste0("+", x), x)
    }
  ) |>
  cfbplotR::gt_fmt_cfb_logo(columns = c("logo")) |> 
  gtExtras::gt_highlight_rows(
    rows = c(1,7),
    fill = "#f2f7fc",
    bold_target_only = TRUE,
    target_col = c(UNC_Coach),
  ) |> 
   gt::tab_header(title = "North Carolina Record by Head Coach  \nagainst NC State") |>
  gt::tab_source_note(source_note = "Bless your chart | data via cfbfastR + gt athletic theme from @andreweatherman")  |>
  gt_theme_athletic() -> unc_table

state_table
NC State Record by Head Coach against North Carolina
Coach W L +/-
Dave Doeren 2013 2023 6 4 -17
Tom O'Brien 2007 2012 5 1 +45
Chuck Amato 2000 2006 3 4 +13
Mike O'Cain 1993 1999 0 7 -89
Dick Sheridan 1988 1992 5 0 +106
Bless your chart | data via cfbfastR + gt athletic theme from @andreweatherman
Code
unc_table
North Carolina Record by Head Coach against NC State
Coach W L +/-
Mack Brown 2.0 2019 2023 2 2 +51
Larry Fedora 2012 2018 3 4 -26
Everett Withers 2011 2011 0 1 -13
Butch Davis 2007 2010 0 4 -40
John Bunting 2001 2006 4 2 +5
Carl Torbush 1998 2000 2 1 -11
Mack Brown 1.0 1988 1997 5 5 -24
Bless your chart | data via cfbfastR + gt athletic theme from @andreweatherman

Result chart

Code
theme_me <- function() {
  # Create a base theme with minimal style
  base_theme <- ggplot2::theme_minimal(base_size = 10, base_family = "RobotoCondensed-Regular")
  
  # Customize the base theme with additional modifications
  custom_theme <- base_theme +
    ggplot2::theme(
      plot.title = ggplot2::element_text(
        hjust = 0.5,
        size = 24,
        face = "bold"
      ),
      plot.subtitle = ggplot2::element_text(
        hjust = 0.5,
        size = 10,
        lineheight = 0.25,
        vjust = -0.5
      ),
      plot.caption = ggplot2::element_text(
        hjust = 0.5,
        size = 6,
        lineheight = 0.35,
        margin = ggplot2::margin(t = 0.5)
      ),
      plot.background = ggplot2::element_rect(fill = "floralwhite", color = "floralwhite")
    )
  
  return(custom_theme)
} 

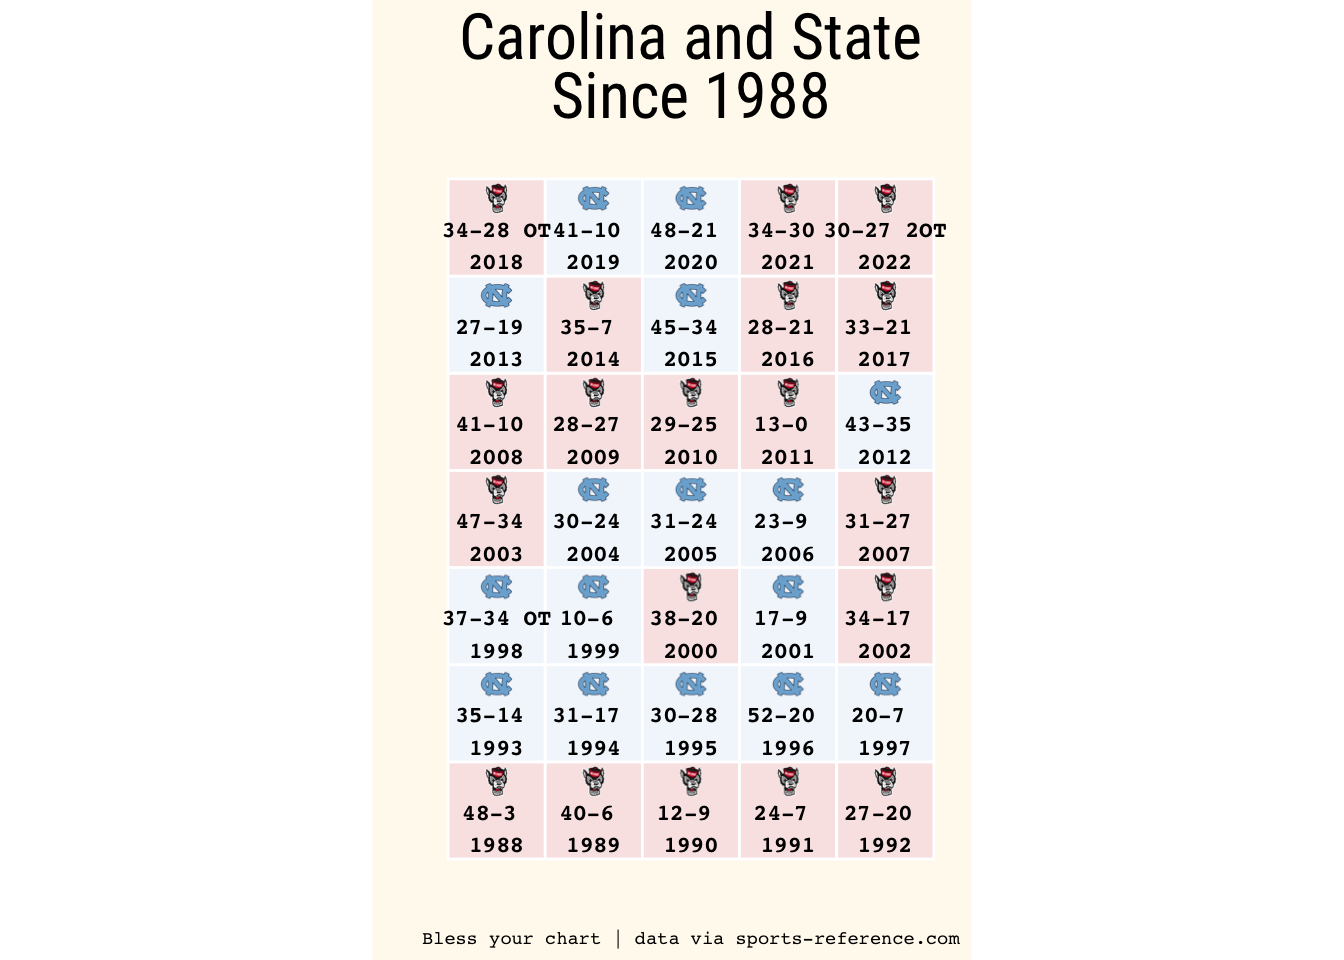
table_final |> 
ggplot2::ggplot(ggplot2::aes(x = team_index, y = season_index, fill = factor(Result))) + 
  ggplot2::geom_tile(color = "white", size = .5) +
  ggplot2::geom_text(ggplot2::aes(label=text_label), vjust = .90,
                     fontface ='bold', family = 'mono',
                    size = 3) +
  cfbplotR::geom_cfb_logos(ggplot2::aes(team = winner, y = season_index + .3), width = 0.065) +
  ggplot2::scale_fill_manual(values = c("#F9E5E5", "#f2f7fc"), name = NULL) +
  ggplot2::coord_equal() +
  theme_me() +
  ggplot2::theme(legend.position = "none", 
                 plot.title = ggtext::element_markdown(),
                 plot.caption = ggtext::element_markdown(size = 7, family = 'mono'),
                 axis.text.x = ggplot2::element_blank(),  
                 axis.text.y = ggplot2::element_blank(),
                 panel.grid = ggplot2::element_blank()) +
  ggplot2::labs(x = "",
                y = "",
                title = "Carolina and State  \nSince 1988",
                caption = "Bless your chart | data via sports-reference.com"
  ) -> result_plot


ggplot2::ggsave(
  "result_plot.png",
  result_plot,
  w = 6.5,
  h = 6.5,
  dpi = 600,
  type = 'cairo'
)

result_plot