Code
wsoc <- readr::read_csv("acc_wsoc.csv")

matrix <- readr::read_csv("matrix.csv")wsoc <- readr::read_csv("acc_wsoc.csv")
matrix <- readr::read_csv("matrix.csv")wsoc_table <- wsoc |>
dplyr::slice(1:14) |>
dplyr::mutate(logo = team) |>
dplyr::relocate(logo, .before = team) |>
dplyr::mutate(diff = gf - ga) |>
dplyr::arrange(-pts) |>
dplyr::select(logo, team, pts, w, l, t, gf, ga, diff) |>
gt::gt() |>
gt::cols_label(
# rename columns
logo = "",
team = "Team",
pts = "Points",
diff = "+/-",
w = "W",
l = "L",
t = "T",
gf = "+",
ga = "-",
diff = "+/-"
) |>
gt::tab_spanner(label = "ACC Only",
columns = c(w, l, t)) |>
gt::tab_spanner(label = "Goal Differential",
columns = c(gf, ga, diff)) |>
cfbplotR::gt_fmt_cfb_logo(columns = "logo") |>
gtExtras::gt_highlight_rows(
rows = c(13:14),
fill = "#FFEBEA",
bold_target_only = TRUE
) |>
gtExtras::gt_highlight_rows(
rows = c(1:5),
fill = "#DDF0B2",
bold_target_only = TRUE
) |>
gt::fmt(
columns = c(diff),
fns = function(x) {
ifelse(x > 0, paste0("+", x), x)
}
) |>
gt::data_color(columns = c(w, l, t, gf, ga, diff),
colors = scales::col_numeric(
c(
"#0a4c6a",
"#73bfe2",
"#cfe8f3",
"#fff2cf",
"#fdd870",
"#fdbf11",
"#ca5800"
),
domain = NULL
)) |>
gt::tab_header(title = "ACC Women's Soccer: Conference Standings",
subtitle = "Teams in green have clinched a spot in ACC Tournament. Teams in red are eliminated, and the rest are competing for one spot.") |>
gt::tab_source_note(source_note = "Bless your chart | October 20") |>
gtExtras::gt_theme_538() |>
gt::tab_style(style = list(gt::cell_borders(
sides = c("left"),
color = "#c1c1c1",
weight = gt::px(2)
)),
locations = list(gt::cells_body(columns = c(w, diff))))
gtExtras::gtsave_extra(wsoc_table,
filename = "wsoc_table.png",
vheight = 875,
vwidth = 600)
wsoc_table| ACC Women's Soccer: Conference Standings | ||||||||
|---|---|---|---|---|---|---|---|---|
| Teams in green have clinched a spot in ACC Tournament. Teams in red are eliminated, and the rest are competing for one spot. | ||||||||
| Team | Points | ACC Only | Goal Differential | |||||
| W | L | T | + | - | +/- | |||
 |
Florida State | 22 | 7 | 0 | 1 | 27 | 10 | +17 |
 |
Clemson | 19 | 6 | 1 | 1 | 20 | 6 | +14 |
 |
Notre Dame | 17 | 5 | 1 | 2 | 21 | 11 | +10 |
 |
North Carolina | 16 | 4 | 0 | 4 | 13 | 6 | +7 |
 |
Pittsburgh | 16 | 5 | 2 | 1 | 21 | 9 | +12 |
 |
Wake Forest | 10 | 2 | 2 | 4 | 11 | 12 | -1 |
 |
Virginia | 9 | 2 | 3 | 3 | 8 | 8 | 0 |
 |
Duke | 9 | 2 | 3 | 3 | 7 | 7 | 0 |
 |
NC State | 9 | 2 | 3 | 3 | 6 | 12 | -6 |
 |
Virginia Tech | 9 | 3 | 5 | 0 | 10 | 10 | 0 |
 |
Louisville | 8 | 2 | 4 | 2 | 7 | 14 | -7 |
 |
Miami | 7 | 2 | 5 | 1 | 5 | 17 | -12 |
 |
Boston College | 2 | 0 | 7 | 2 | 4 | 19 | -15 |
 |
Syracuse | 1 | 0 | 7 | 1 | 7 | 26 | -19 |
| Bless your chart | October 20 | ||||||||
tile_plot <- matrix |>
              ggplot2::ggplot(ggplot2::aes(x = num, y = tie_number, fill = factor(unc_goal))) +
  ggplot2::geom_tile(color = "white", size = .5) +
  ggplot2::scale_fill_manual(values = c("lightpink", "#56a0d3"), name = NULL) +
  ggplot2::coord_equal() +
  ggthemes::theme_fivethirtyeight() +
  ggplot2::theme(legend.position = "none",
                 line = ggplot2::element_blank(),
                 axis.line = ggplot2::element_blank(),
                 axis.text = ggplot2::element_blank(),
                 panel.grid.major = ggplot2::element_blank(),
                 panel.grid.minor = ggplot2::element_blank()) +
  ggplot2::labs(title = "North Carolina Women's Soccer is 9-0-7 overall \nTie games with goals shown below",
                subtitle ="The Tar Heels have had a lead in all five of these games that have ended in a tie") +
  ggplot2::annotate(
    cfbplotR::GeomCFBlogo,
    x = -.1,
    y = 1,
    team = "Alabama",
    height = .065,
  ) +
  ggplot2::annotate(
    cfbplotR::GeomCFBlogo,
    x = -.1,
    y = 2,
    team = "Florida State",
    height = .065,
  ) +
  ggplot2::annotate(
    cfbplotR::GeomCFBlogo,
    x = -.1,
    y = 3,
    team = "Duke",
    height = .065,
  ) +
  ggplot2::annotate(
    cfbplotR::GeomCFBlogo,
    x = -.1,
    y = 4,
    team = "Wake Forest",
    height = .065,
  ) +
  ggplot2::annotate(
    cfbplotR::GeomCFBlogo,
    x = -.1,
    y = 5,
    team = "Notre Dame",
    height = .065,
  ) +
    ggplot2::annotate(
    geom = "label",
    x = 4.5,
    y = 4.5,
    label = "Blue tile is UNC goal  \nPink tile is opponent goal",
    color = "#333333",
    size = 4,
    fill = "floral white",
    alpha = 0.1,
    size = 4,
  )

tile_plot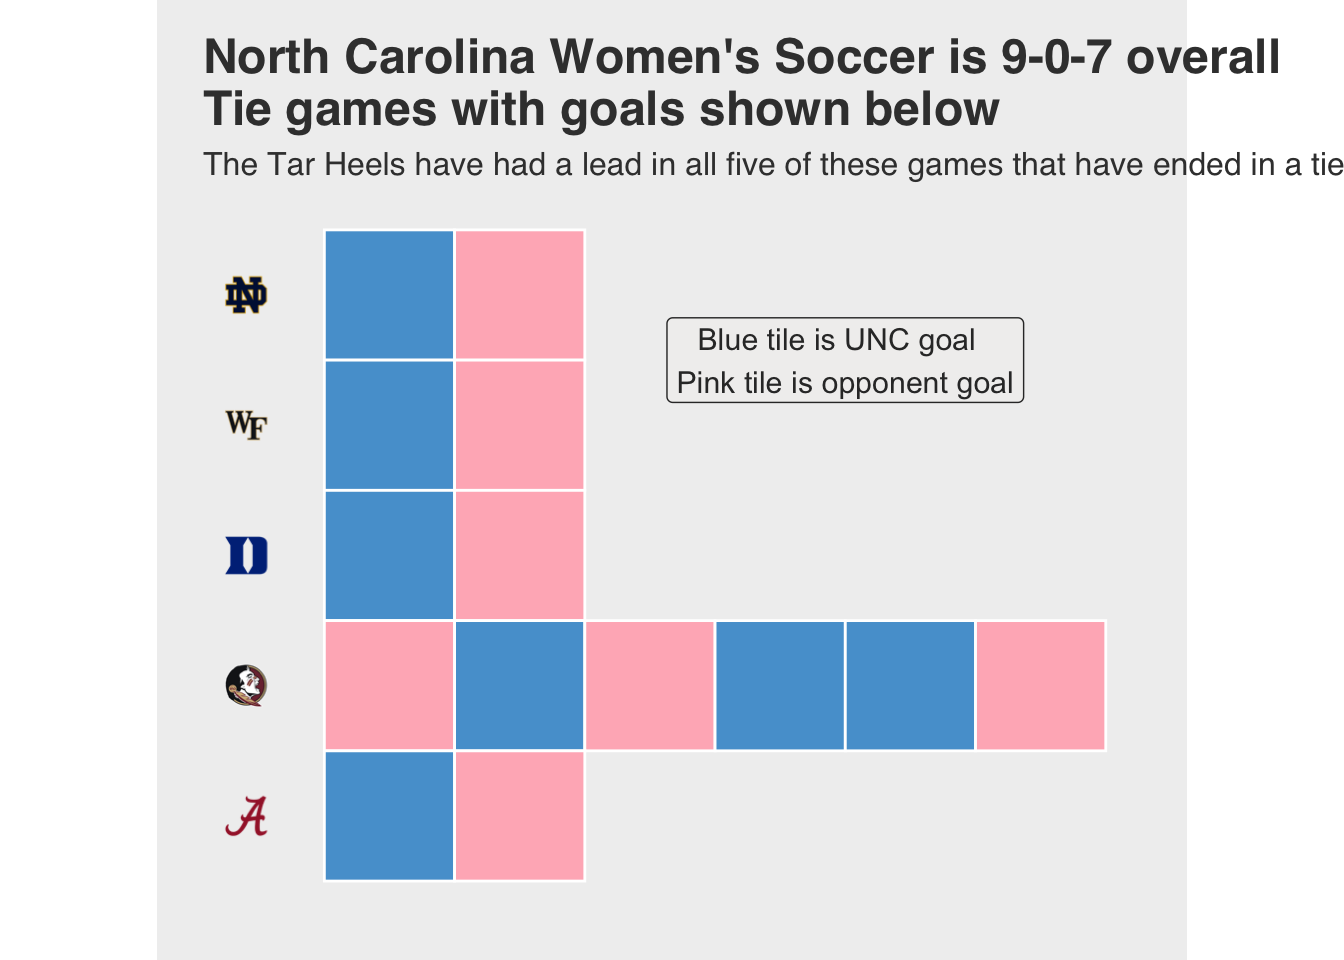
ggplot2::ggsave(
  "tile_plot.png",
  tile_plot,
  w = 8,
  h = 8,
  dpi = 600,
  type = 'cairo'
)