052: Spurtability

gt_nano
Published

October 16, 2023

Load data

Code
spurtle <- readr::read_csv("spurts.csv")

# xpl <- fbs_games_drives |> 
#  dplyr::mutate(yds_play = yards/plays) |> 
#  dplyr::filter(yds_play >= 7.5) |> 
#  dplyr::group_by(team_name) |> 
#  dplyr::summarise(total_xpl = dplyr::n(),
#                   total_tds = sum(result == "TOUCHDOWN"),
#                   total_fgs = sum(result == "FIELD GOAL"),
#                   total_empty = sum(!result %in% 
#                                       c("TOUCHDOWN", "FIELD GOAL")),
#                   td_pct = sum(result == "TOUCHDOWN") / total_xpl,
#                   fg_pct = sum(result == "FIELD GOAL") / total_xpl,
#                   empty_pct = sum(!result %in% 
#                                     c("TOUCHDOWN", "FIELD GOAL")) /  total_xpl)

# xpl_opp <- fbs_games_drives |> 
#  dplyr::mutate(yds_play = yards/plays) |> 
#  dplyr::filter(yds_play >= 7.5) |> 
#  dplyr::group_by(opponent) |> 
#  dplyr::summarise(total_xpl = dplyr::n(),
#                   total_tds = sum(result == "TOUCHDOWN"),
#                   total_fgs = sum(result == "FIELD GOAL"),
#                   total_empty = sum(!result %in% 
#                                       c("TOUCHDOWN", "FIELD GOAL")),
#                   td_pct = sum(result == "TOUCHDOWN") / total_xpl,
#                   fg_pct = sum(result == "FIELD GOAL") / total_xpl,
#                   empty_pct = sum(!result %in% 
#                                     c("TOUCHDOWN", "FIELD GOAL")) / total_xpl)

# xpl |> 
#  dplyr::mutate(points = (total_tds * 6 + total_fgs * 3),
#                pts_spurt = points / log2(sum(total_xpl))) |> 
#  dplyr::select(team_name, pts_spurt, points, total_xpl, total_tds, 
#                total_fgs, total_empty) -> offense 

# xpl_opp |> 
#  dplyr::mutate(opp_points = (total_tds * 6 + total_fgs * 3),
#                opp_pts_spurt = opp_points / log2(sum(total_xpl))) |> 
#  dplyr::select(team_name = opponent, opp_pts_spurt, opp_points, 
#                opp_total_xpl = total_xpl, 
#                opp_total_tds = total_tds, 
#                opp_total_fgs = total_fgs, 
#                opp_total_empty = total_empty) -> defense

# spurtle <- dplyr::left_join(offense, defense, by = "team_name") |> 
#          dplyr::mutate(delta = pts_spurt - opp_pts_spurt) |> 
#           dplyr::arrange(-delta)

GT Table w/nano plot

Code
spurtle |> 
  dplyr::mutate(logo = team_name) |> 
  dplyr::slice(1:15) |> 
  dplyr::select(logo, team_name, delta, pts_spurt, total_xpl, opp_pts_spurt,
                opp_total_xpl) |> 
  gt::gt() |> 
  cfbplotR::gt_fmt_cfb_logo(columns = c("logo")) |> 
  gt::cols_label(
    logo = "",
    team_name = "",
    delta = "+/-",
    pts_spurt = "Pts/Spurt",
    total_xpl = "Spurts",
    opp_pts_spurt = "Pts/Spurt",
    opp_total_xpl = "Spurts",
  ) |> 
  gt::tab_spanner(label = "Offense",
                  columns = c(pts_spurt, total_xpl)) |>
  gt::tab_spanner(label = "Defense",
                  columns = c(opp_pts_spurt, opp_total_xpl)) |>
  gt::fmt_number(columns = c(delta, pts_spurt, opp_pts_spurt),
                 decimals = 1,
                 use_seps = FALSE) |> 
  gt::cols_nanoplot(
    columns = c(pts_spurt, opp_pts_spurt),
    new_col_name = "Spurts",
    new_col_label = "Spurtability",
    plot_type = "bar",
    options = gt::nanoplot_options(
      show_data_line = FALSE,
      show_data_area = FALSE,
      data_bar_stroke_color = "transparent",
      data_bar_fill_color = c("lightgreen", "lightpink")
    )
  ) |> 
  gt::data_color(
    columns = c(delta),
    fn = scales::col_numeric(
      c(
        "lightpink",
        "lightgreen"
      ),
      domain = c(11:1)
    )
  ) |> 
  gtExtras::gt_theme_538() |> 
  gt::tab_header(
    title = "Spurtability of FBS Teams",
    subtitle = "Spurtability measures a team's ability to create, 
    score, and prevent big drives."
  ) |> 
  gt::tab_source_note(source_note = "Bless your chart | October 16, 2023") |> 
  gt::tab_style(
    style = list(
      gt::cell_borders(
        sides = c("left"),
        color = "#c1c1c1",
        weight = gt::px(2)
      )
    ),
    locations = list(
      gt::cells_body(
        columns = c(pts_spurt, opp_pts_spurt, Spurts)
      )
    )
  ) -> spurt_table 

gtExtras::gtsave_extra(spurt_table, 
                       filename = "spurt_table.png", vheight = 875, vwidth = 775)
  
spurt_table
Spurtability of FBS Teams
Spurtability measures a team's ability to create, score, and prevent big drives.
+/- Offense Defense Spurtability
Pts/Spurt Spurts Pts/Spurt Spurts
Florida State 10.8 14.4 27 3.5 12
14.4 0 14.4 3.53
Washington 9.8 17.1 38 7.3 19
17.1 0 17.1 7.32
USC 9.2 19.5 39 10.3 24
19.5 0 19.5 10.3
Oklahoma 9.0 11.9 23 3.0 9
11.9 0 11.9 2.98
Michigan 8.7 10.8 22 2.2 6
10.8 0 10.8 2.17
Georgia 8.1 12.7 27 4.6 9
12.7 0 12.7 4.61
Liberty 7.3 12.2 28 4.9 13
12.2 0 12.2 4.88
Alabama 6.8 10.8 23 4.1 10
10.8 0 10.8 4.07
Notre Dame 6.8 11.1 24 4.3 11
11.1 0 11.1 4.34
Texas 6.2 10.3 22 4.1 9
10.3 0 10.3 4.07
Duke 6.0 7.6 16 1.6 10
7.59 0 7.59 1.63
Oregon 6.0 10.3 20 4.3 9
10.3 0 10.3 4.34
North Carolina 5.7 11.9 24 6.2 14
11.9 0 11.9 6.24
Missouri 5.7 12.2 25 6.5 16
12.2 0 12.2 6.51
Ohio State 5.7 7.9 17 2.2 5
7.87 0 7.87 2.17
Bless your chart | October 16, 2023

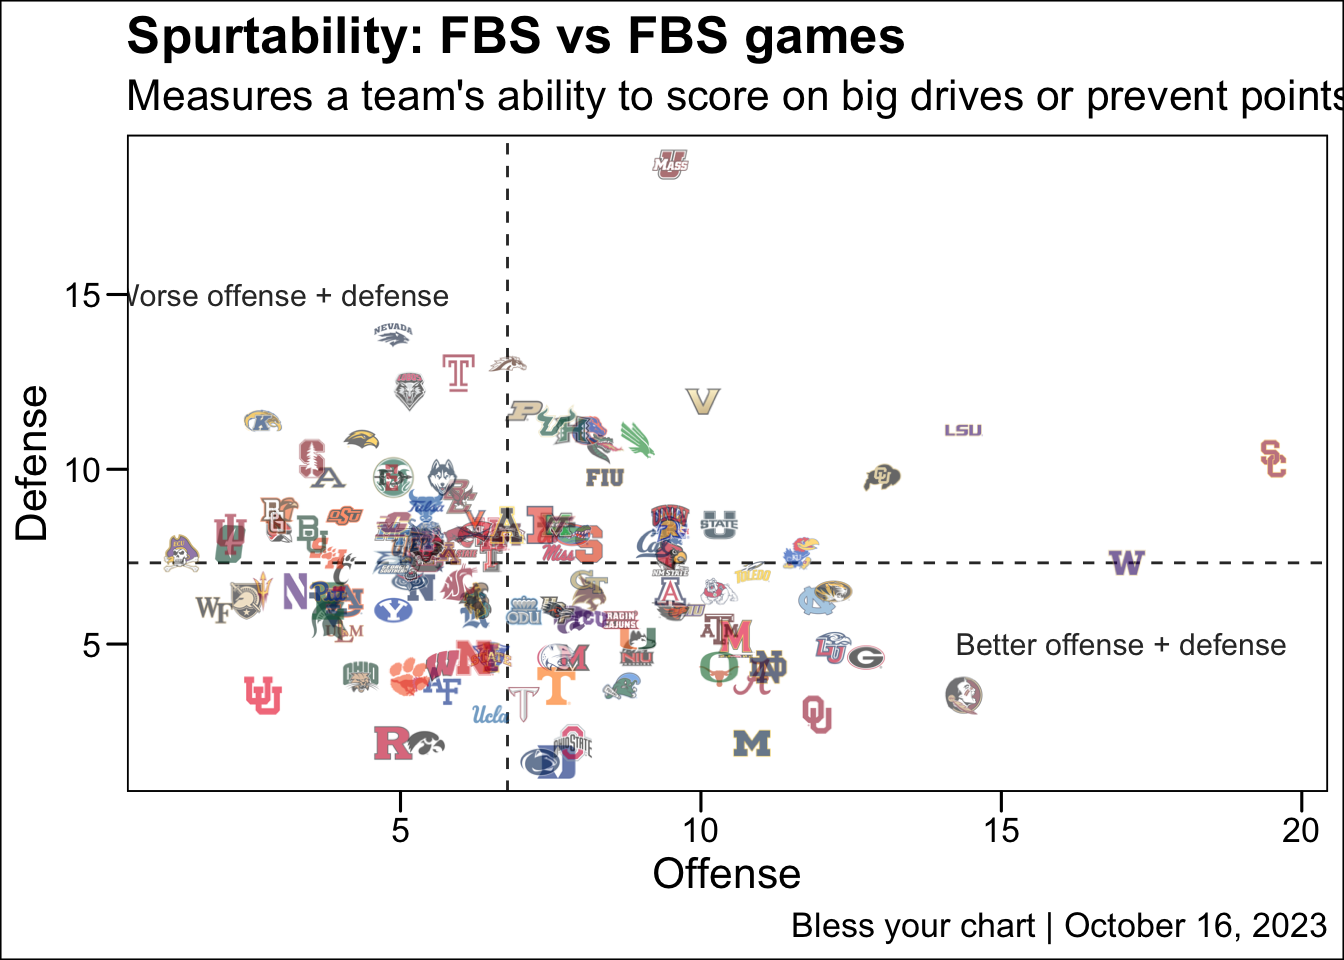
Spurt plot

Code
spurtle |> 
  ggplot2::ggplot(ggplot2::aes(x = pts_spurt, opp_pts_spurt)) +
  cfbplotR::geom_median_lines(ggplot2::aes(v_var = pts_spurt,
                          h_var = opp_pts_spurt), color = "#333333") +
  cfbplotR::geom_cfb_logos(ggplot2::aes(team = team_name), 
                           width = 0.035, alpha = 0.6) +
  ggplot2::labs(x = "Offense", 
                y = "Defense", 
        title = "Spurtability: FBS vs FBS games",
        subtitle = "Measures a team's ability to score on big drives or prevent points on big drives", 
        caption = "Bless your chart | October 16, 2023") + 
  ggthemes::theme_base() +
  ggplot2::annotate(
    geom = "text",
    x = 17,
    y = 5,
    color = "#333333",
    label = "Better offense + defense",
    size = 4,
  ) + 
  ggplot2::annotate(
    geom = "text",
    x = 3,
    y = 15,
    color = "#333333",
    label = "Worse offense + defense",
    size = 4,
  )  -> spurt_plot 


ggplot2::ggsave(
  "spurt_plot.png",
  spurt_plot,
  w = 9,
  h = 8.5,
  dpi = 600,
  type = 'cairo'
)

spurt_plot