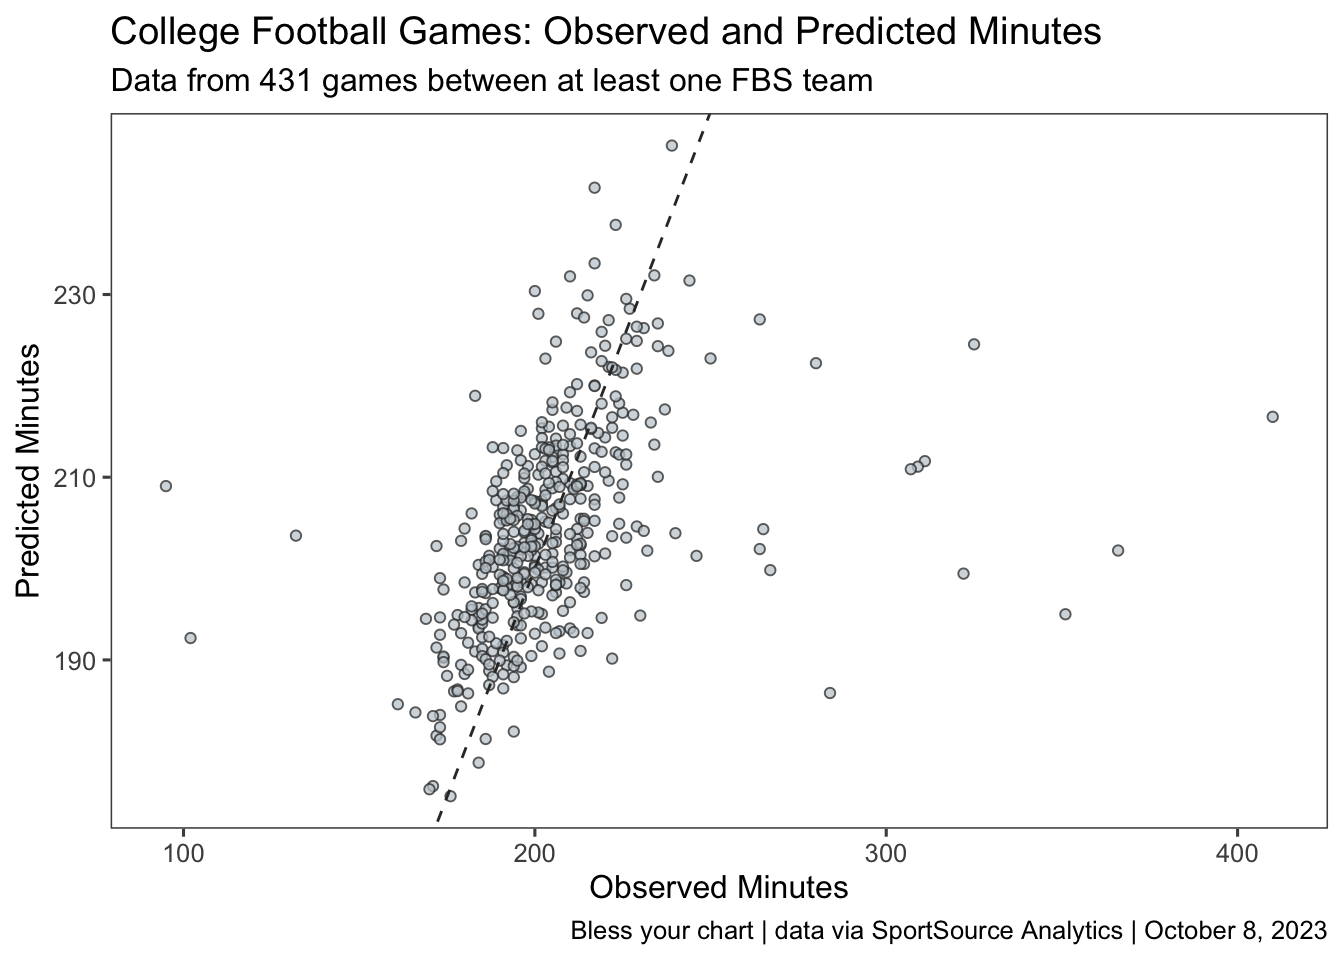
ggplot2::ggplot(data = kore_games, ggplot2::aes(y = predicted_minutes, x = minutes)) + ggplot2::geom_point(color ="#333333",fill ="#c4ced4",shape =21,size =1.5,alpha = .75) + ggplot2::geom_abline(slope =1, intercept =0, color ="#333333", linetype ="dashed") + ggplot2::labs(x ="Observed Minutes", y ="Predicted Minutes",title ="College Football Games: Observed and Predicted Minutes", subtitle ="Data from 431 games between at least one FBS team", caption ="Bless your chart | data via SportSource Analytics | October 8, 2023") + ggthemes::theme_few() -> fbs_plotggplot2::ggsave("fbs_plot.png", fbs_plot,w =6,h =6,dpi =600,type ='cairo')fbs_plot