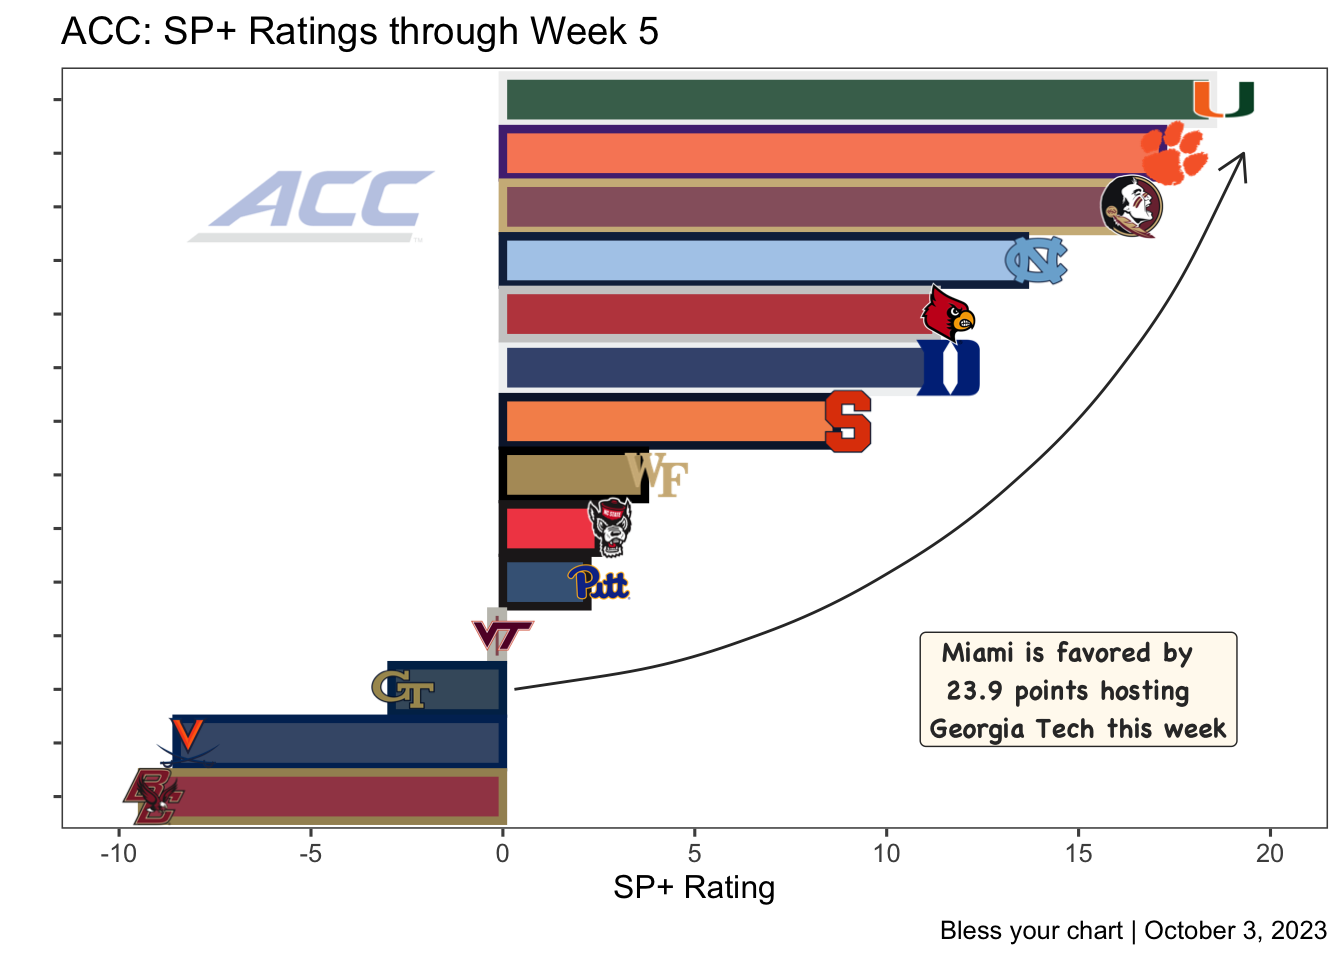
Code
sp_conf <- readr::read_csv("conf_sp.csv")October 3, 2023
sp_conf |>
    dplyr::filter(conference == "ACC") |>
   dplyr::mutate(team = forcats::fct_reorder(team,ranking)) |>
   ggplot2::ggplot(ggplot2::aes(x = team, y = ranking)) +
   ggplot2::geom_col(ggplot2::aes(fill = team, color = team),size = 1.5) +
    cfbplotR::geom_cfb_logos(ggplot2::aes(team = team, y = ranking + .3), width = 0.055) +
    ggplot2::annotate(cfbplotR::GeomCFBlogo,x = "Florida State",y = -5,team = "ACC",height = .35,alpha = .3) +
    cfbplotR::scale_fill_cfb(alpha = .8) +
    ggplot2::annotate(
        geom = "curve",
        color = "#333333",
        x = "Georgia Tech",
        y = 0.3,
        xend = "Clemson",
        yend = 19.3,
        curvature = .3,
        arrow = ggplot2::arrow(length = ggplot2::unit(4, "mm"))
    ) +
    ggplot2::annotate(
        "label",
        x = "Georgia Tech",
        y = 15,
        label = "Miami is favored by  \n23.9 points hosting  \nGeorgia Tech this week",
        family = "Chalkboard Bold",
        size = 3.5,
        color = "#333333",
        fontface = "bold",
        fill = "floral white"
    ) +
    cfbplotR::scale_color_cfb(alt_colors = sp_conf$team) +
    ggplot2::scale_y_continuous(breaks = seq(-10, 20, 5), limits = c(-10, 20)) +
    ggplot2::labs(x = "", y = "SP+ Rating", title = "ACC: SP+ Ratings through Week 5", caption = "Bless your chart | October 3, 2023") +
    ggthemes::theme_few() +
    #theme_x_cfb()
    ggplot2::theme(axis.text.y = ggplot2::element_blank()) +
    ggplot2::coord_flip()  -> sp_acc

ggplot2::ggsave(
  "sp_acc.png",
  sp_acc,
  w = 9,
  h = 8.5,
  dpi = 600,
  type = 'cairo'
)

sp_acc