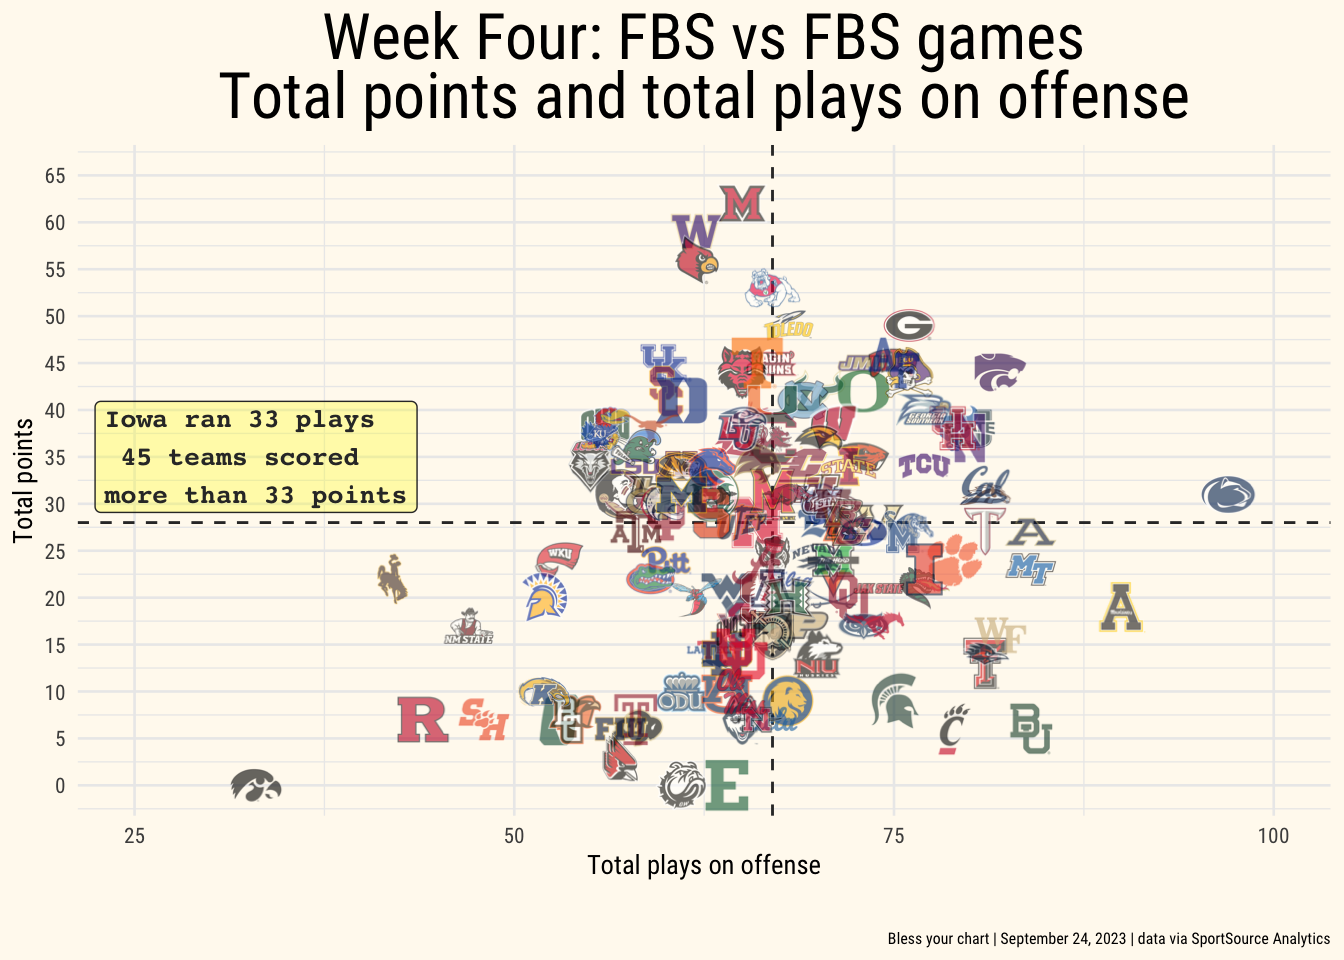
049: Week four (Iowa)

geom_scatter
Published

September 24, 2023

Load data

Code
week_four <- readr::read_csv("week_four.csv")

Set the theme

Code
theme_me <- function() {
  # Create a base theme with minimal style
  base_theme <- ggplot2::theme_minimal(base_size = 10, base_family = "RobotoCondensed-Regular")
  
  # Customize the base theme with additional modifications
  custom_theme <- base_theme +
    ggplot2::theme(
      plot.title = ggplot2::element_text(
        hjust = 0.5,
        size = 24,
        face = "bold"
      ),
      plot.subtitle = ggplot2::element_text(
        hjust = 0.5,
        size = 10,
        lineheight = 0.25,
        vjust = -0.5
      ),
      plot.caption = ggplot2::element_text(
        hjust = 1,
        size = 6,
        lineheight = 0.35,
        margin = ggplot2::margin(t = 20)
      ),
      plot.background = ggplot2::element_rect(fill = "floralwhite", color = "floralwhite")
    )
  
  return(custom_theme)
} 

Iowa

Code
week_four |> 
  ggplot2::ggplot(ggplot2::aes(x = plays, y = points)) +
  cfbplotR::geom_median_lines(ggplot2::aes(v_var = plays, h_var = points), color = "#333333") +
  cfbplotR::geom_cfb_logos(ggplot2::aes(team = team), width = 0.045, alpha = 0.6) +
  ggplot2::labs(x = "Total plays on offense", y = "Total points", title = "Week Four: FBS vs FBS games  \nTotal points and total plays on offense", caption = "Bless your chart | September 24, 2023 | data via SportSource Analytics") +
   ggplot2::scale_x_continuous(breaks = seq(25, 100, 25), limits = c(25, 100)) +
  ggplot2::scale_y_continuous(breaks = seq(0, 65, 5), limits = c(-0, 65)) +
  theme_me() +
  ggplot2::theme(legend.position = "none", plot.title = ggtext::element_markdown()) +
  ggplot2::annotate(
    geom = "label",
    x = 33,
    y = 35,
    color = "#333333",
    fill = "yellow",
    label = "Iowa ran 33 plays  \n45 teams scored  \nmore than 33 points",
    size = 3.5,
    fontface = 'bold',
    family = 'mono',
    alpha = 0.3
  ) -> iowa_plot

ggplot2::ggsave(
  "iowa.png",
  iowa_plot,
  w = 9,
  h = 8.5,
  dpi = 600,
  type = 'cairo'
)

iowa_plot