SEC Football: SP+ Average Percentile Rankings by Decade
Full time members across all three decades in yellow.
Team
2020s
2010s
2000s
Avg.
Trend
Avg.
Trend
Avg.
Trend
Alabama
98.9
98.3
83.2
Georgia
97.8
91.1
90.3
Oklahoma
89.4
92.7
94.6
Texas A&M
86.2
86.8
66.2
Florida
84.2
83.1
91.5
Texas
83.7
72.1
95.7
Ole Miss
81.8
70.2
65.5
LSU
80.6
93.3
90.3
Kentucky
78.4
61.0
55.9
Tennessee
76.0
69.8
81.7
Auburn
74.1
85.2
82.8
Mississippi State
69.2
81.8
45.1
Arkansas
68.5
64.5
75.7
Missouri
63.3
77.5
71.1
South Carolina
60.6
76.6
73.3
Vanderbilt
20.3
55.8
44.5
@dadgumboxscores | June 20, 2023 | data via @ESPN_BillC
Make rolling mean tables
Code
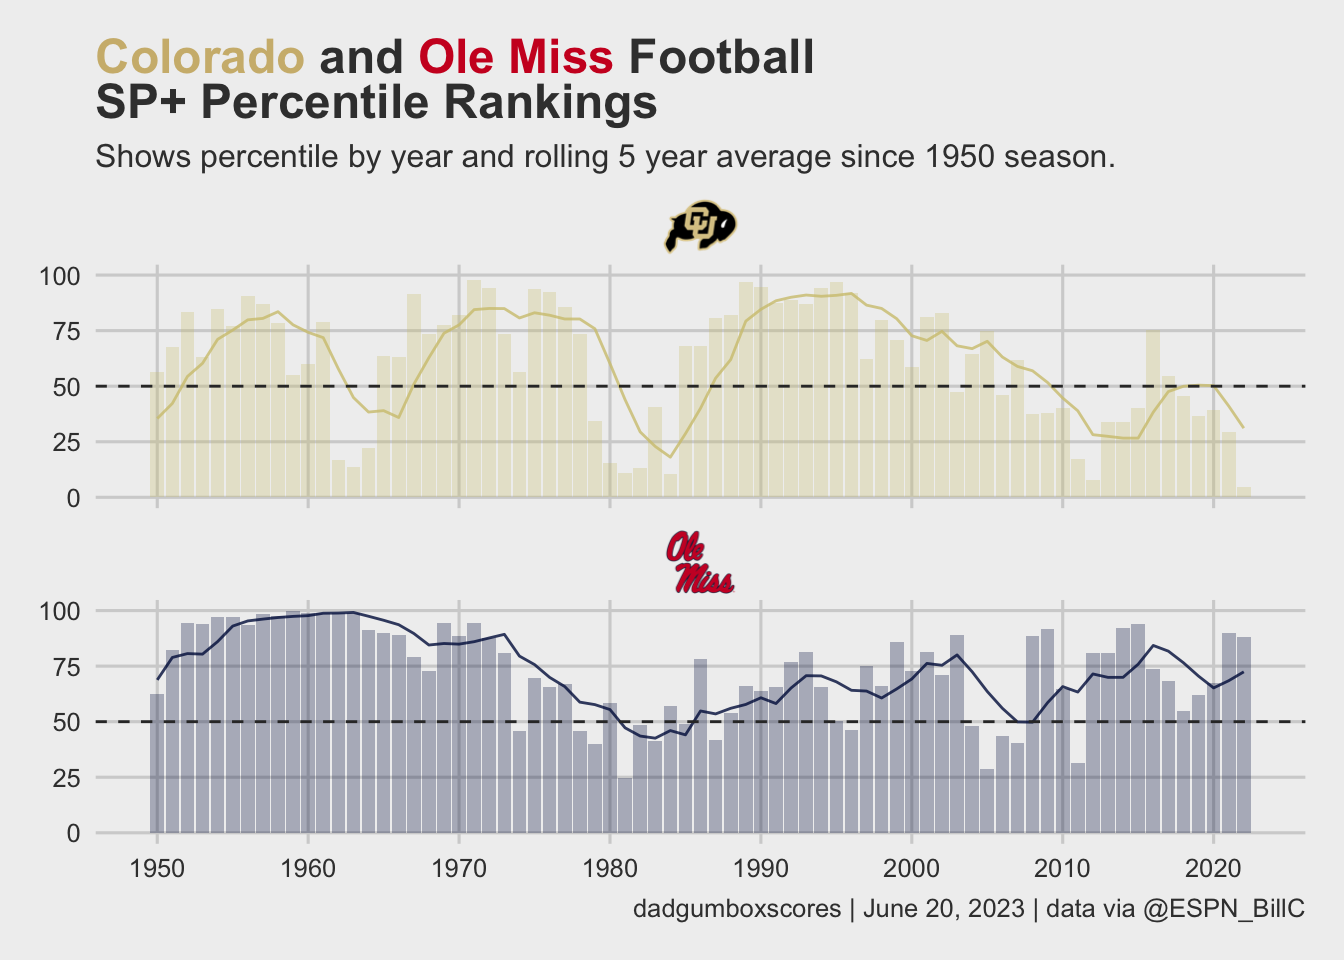
# make rolling mean tablessp_data |> dplyr::filter(team %in%c("Ole Miss", "Colorado")) |> dplyr::filter(year >1949) |> ggplot2::ggplot(ggplot2::aes(x = year, y = pctile)) + ggplot2::geom_col(alpha =3/10,linetype =0, ggplot2::aes(fill = team)) + ggplot2::geom_line(ggplot2::aes(x = year, y = avg, color = team)) + cfbplotR::scale_color_cfb(alpha = .8) + cfbplotR::scale_fill_cfb(alpha = .8) + ggplot2::facet_wrap( ~ team, nrow =4) + ggplot2::geom_hline(yintercept =50.0,linetype ='dashed',color ="#333333") + ggplot2::scale_x_continuous(breaks =seq(1950, 2022, 10)) + ggplot2::scale_y_continuous(breaks =seq(0, 100, 25)) + ggthemes::theme_fivethirtyeight() + ggplot2::theme(strip.text = cfbplotR::element_cfb_logo(size =1),plot.title = ggtext::element_markdown(),plot.subtitle = ggtext::element_markdown(),text = ggplot2::element_text(family ="Arial"),panel.grid = ggplot2::element_blank() ) + ggplot2::labs(x ="",y ="",title ="<span style='color:#CFB87C;'>Colorado</span> and <span style='color:#CE1126;'>Ole Miss</span> Football \nSP+ Percentile Rankings",subtitle ="Shows percentile by year and rolling 5 year average since 1950 season.",caption ="dadgumboxscores | June 20, 2023 | data via @ESPN_BillC" ) -> sp_data_plotggplot2::ggsave("sp_plot.png", sp_data_plot,w =8,h =8,dpi =600,type ='cairo')sp_data_plot
Coach GT Tables
Code
sp_data |> dplyr::filter(year >2004& conf =="ACC") |> dplyr::filter(team !="Notre Dame") |> dplyr::select(year, team, pctile, off_pctile, def_pctile) |> dplyr::mutate(coach = dplyr::case_when( team =="North Carolina"& year <2007~"John Bunting", team =="North Carolina"& year >2006& year <2011~"Butch Davis", team =="North Carolina"& year ==2011~"Everett Withers", team =="North Carolina"& year >2011& year <2019~"Larry Fedora", team =="North Carolina"& year >2018~"Mack Brown 2.0", team =="Florida State"& year <2010~"Bobby Bowden", team =="Florida State"& year >2009& year <2018~"Jimbo Fisher", team =="Florida State"& year >2017& year <2019~"Willie Taggart", team =="Florida State"& year ==2019~"Willie Taggart/Odell Haggins", team =="Florida State"& year >2019~"Mike Norvell", team =="Boston College"& year <2007~"Tom O'Brien", team =="Boston College"& year <2009& year >2006~"Jeff Jagodzinkski", team =="Boston College"& year >2008& year <2013~"Frank Spaziani", team =="Boston College"& year >2012& year <2020~"Steve Addazio", team =="Boston College"& year >2019~"Jeff Hafley", team =="Clemson"& year <2008~"Tommy Bowden", team =="Clemson"& year ==2008~"Tommy Bowden/Dabo Swinney", team =="Clemson"& year >2008~"Dabo Swinney", team =="NC State"& year <2007~"Chuck Amato", team =="NC State"& year >2006& year <2013~"Tom O'Brien", team =="NC State"& year >2012~"Dave Doeren", team =="Maryland"& year <2011~"Ralph Friedgen", team =="Maryland"& year >2010~"Randy Edsall", team =="Wake Forest"& year <2014~"Jim Grobe", team =="Wake Forest"& year >2013~"Dave Clawson", team =="Virginia Tech"& year <2016~"Frank Beamer", team =="Virginia Tech"& year >2015& year <2021~"Justin Fuente", team =="Virginia Tech"& year ==2021~"Justin Fuente/JC Price", team =="Virginia Tech"& year ==2022~"Brent Pry", team =="Miami"& year <2007~"Larry Coker", team =="Miami"& year >2006& year <2011~"Randy Shannon", team =="Miami"& year >2010& year <2015~"Al Golden", team =="Miami"& year ==2015~"Al Golden/Larry Scott", team =="Miami"& year >2015& year <2019~"Mark Richt", team =="Miami"&year >2018& year <2022~"Manny Diaz", team =="Miami"& year ==2022~"Mario Cristobal", team =="Georgia Tech"& year <2008~"Chan Gailey", team =="Georgia Tech"& year >2007& year <2019~"Paul Johnson", team =="Georgia Tech"& year >2018& year <2022~"Geoff Collins", team =="Georgia Tech"& year ==2022~"Geoff Collins/Brent Key", team =="Virginia"& year <2010~"Al Groh", team =="Virginia"& year >2009& year <2016~"Mike London", team =="Virginia"& year >2015& year <2022~"Bronco Mendenhall", team =="Virginia"& year ==2022~"Tony Elliott", team =="Duke"& year <2008~"Ted Roof", team =="Duke"& year >2007& year <2022~"David Cutcliffe", team =="Duke"& year ==2022~"Mike Elko", team =="Syracuse"& year >2012& year <2016~"Scott Shafer", team =="Syracuse"& year >2015~"Dino Barbers", team =="Pittsburgh"& year <2015~"Paul Chryst", team =="Pittsburgh"& year >2014~"Pat Narduzzi", team =="Louisville"& year <2018~"Bobby Petrino", team =="Louisville"& year ==2018~"Bobby Petrino/Lorenzo Ward", team =="Louisville"& year >2018~"Scott Satterfield",TRUE~NA_character_ )) -> coachescoaches |> dplyr::group_by(coach, team) |> dplyr::summarise(avg_overall =mean(pctile), avg_off =mean(off_pctile),avg_def =mean(def_pctile),total_szn = dplyr::n(),.groups ="drop") |> dplyr::arrange(-total_szn) |> dplyr::filter(team !="Maryland") -> the_coachthe_coach |> dplyr::filter(team %in%c("NC State", "North Carolina", "Duke", "Wake Forest")) |> dplyr::mutate(logo = team) |> dplyr::select(logo, team, coach, total_szn, avg_overall, avg_off, avg_def) |> gt::gt(groupname_col ="team") |> gt::cols_label(# rename columnslogo ="",coach ="Head Coach",total_szn ="Seasons",avg_overall ="Overall",avg_off ="Offense",avg_def ="Defense" ) |> gt::tab_spanner(label ="Average SP+ Percentile",columns =c(avg_overall, avg_off, avg_def)) |> cfbplotR::gt_fmt_cfb_logo(columns ="logo") |> gt::fmt_number(columns =c(avg_overall, avg_off, avg_def),decimals =2,use_seps =FALSE) |> gt::tab_header(title ="ACC Football Since 2005: Average SP+ Percentiles by Coach") |> gt::tab_source_note(source_note ="@dadgumboxscores | June 28, 2023 | data via @ESPNBill_BillC") |> gtExtras::gt_theme_538() -> first_four first_four
ACC Football Since 2005: Average SP+ Percentiles by Coach
Head Coach
Seasons
Average SP+ Percentile
Overall
Offense
Defense
Duke
David Cutcliffe
14
47.81
45.91
49.75
Ted Roof
3
11.17
11.00
24.20
Mike Elko
1
71.60
58.50
77.00
NC State
Dave Doeren
10
66.95
58.52
68.66
Tom O'Brien
6
54.88
53.20
57.13
Chuck Amato
2
52.25
21.65
80.50
Wake Forest
Dave Clawson
9
59.26
56.69
57.91
Jim Grobe
9
48.80
36.38
60.91
North Carolina
Larry Fedora
7
65.84
71.29
53.96
Butch Davis
4
64.78
42.17
79.03
Mack Brown 2.0
4
69.53
80.85
48.60
John Bunting
2
36.20
25.40
49.75
Everett Withers
1
61.50
57.20
67.40
@dadgumboxscores | June 28, 2023 | data via @ESPNBill_BillC