# example to scrape sports-reference and grab records # this is only for one team # url <- "https://www.sports-reference.com/cfb/schools/north-carolina"# page <- read_html(url)# table_rows <- page %>%# html_nodes("table#north-carolina tbody tr")# year <- c()# win <- c()# loss <- c()# for (row in table_rows) {# cells <- row %>% html_nodes("th, td")# year <- c(year, cells[2] %>% html_text(trim = TRUE))# win <- c(win, cells[8] %>% html_text(trim = TRUE))# loss <- c(loss, cells[9] %>% html_text(trim = TRUE))# }# unc_table <- data.frame(year = year, win = as.numeric(win), loss = as.numeric(loss)) %>% # slice(1:18) %>% # mutate(team = "North Carolina")# save data in csv format to load acc_hist <- readr::read_csv("acc_hist.csv")acct <- readr::read_csv("acc_fball.csv")
Make GT Table
Code
# make table acc_wp <- acct |> dplyr::filter(team !="Notre Dame") |> dplyr::select(-...1) |> dplyr::mutate(logo = team) |> dplyr::relocate(logo, .before = team) |> dplyr::relocate(division, .before = total_wins) |> dplyr::arrange(-win_pct) |> gt::gt() |> gt::cols_label(# rename columnslogo ="",team ="Team",division ="Division",total_wins ="W",total_loss ="L",win_pct ="Win %",title_apps ="Division",titles ="League" ) |> gt::tab_spanner(label ="Titles",columns =c(title_apps, titles)) |> cfbplotR::gt_fmt_cfb_logo(columns ="logo") |> gt::fmt_number(columns = win_pct,decimals =3,use_seps =FALSE) |> gtExtras::gt_fa_repeats(column = titles,palette ="orange",name ="trophy",align ='left' ) |> gt::data_color(columns =c(win_pct),colors = scales::col_numeric(c("#0a4c6a","#73bfe2","#cfe8f3","#fff2cf","#fdd870","#fdbf11","#ca5800" ),domain =NULL )) |> gt::tab_header(title ="ACC Football Regular Season Conference Records from 2005 to 2022 Seasons",subtitle ="Excludes wins or losses from conference championship games and non-conference meetings") |> gt::tab_source_note(source_note ="@dadgumboxscores | June 13, 2023 | data via sports-reference.com") |> gtExtras::gt_theme_538() |> gt::tab_footnote(footnote ="2020 season did not use divisions (Notre Dame was 9-0 in conference play that season).",locations = gt::cells_column_labels(columns = team)) |> gt::tab_style(style =list(gt::cell_borders(sides =c("left"),color ="#c1c1c1",weight = gt::px(2) )),locations =list(gt::cells_body(columns =c(total_wins))))gt::gtsave(acc_wp, 'acc_wp.png')acc_wp
ACC Football Regular Season Conference Records from 2005 to 2022 Seasons
Excludes wins or losses from conference championship games and non-conference meetings
Team1
Division
W
L
Win %
Titles
Division
League
Clemson
Atlantic
114
31
0.786
8
list(name = "div", attribs = list(title = "8 trophy", `aria-label` = "8 trophy", role = "img"), children = list(list(" ")))
Virginia Tech
Coastal
92
53
0.634
6
list(name = "div", attribs = list(title = "3 trophy", `aria-label` = "3 trophy", role = "img"), children = list(list(" ")))
Florida State
Atlantic
87
57
0.604
5
list(name = "div", attribs = list(title = "4 trophy", `aria-label` = "4 trophy", role = "img"), children = list(list(" ")))
Pittsburgh
Coastal
48
34
0.585
2
list(name = "div", attribs = list(title = "1 trophy", `aria-label` = "1 trophy", role = "img"), children = list(list("")))
Miami
Coastal
81
64
0.559
1
list(name = "div", attribs = list(title = "0 trophy", `aria-label` = "0 trophy", role = "img"), children = list(list("")))
Georgia Tech
Coastal
78
67
0.538
4
list(name = "div", attribs = list(title = "1 trophy", `aria-label` = "1 trophy", role = "img"), children = list(list("")))
Louisville
Atlantic
37
37
0.500
0
list(name = "div", attribs = list(title = "0 trophy", `aria-label` = "0 trophy", role = "img"), children = list(list("")))
North Carolina
Coastal
72
74
0.493
2
list(name = "div", attribs = list(title = "0 trophy", `aria-label` = "0 trophy", role = "img"), children = list(list("")))
Boston College
Atlantic
65
81
0.445
2
list(name = "div", attribs = list(title = "0 trophy", `aria-label` = "0 trophy", role = "img"), children = list(list("")))
NC State
Atlantic
65
81
0.445
0
list(name = "div", attribs = list(title = "0 trophy", `aria-label` = "0 trophy", role = "img"), children = list(list("")))
Wake Forest
Atlantic
61
82
0.427
2
list(name = "div", attribs = list(title = "1 trophy", `aria-label` = "1 trophy", role = "img"), children = list(list("")))
Virginia
Coastal
55
89
0.382
1
list(name = "div", attribs = list(title = "0 trophy", `aria-label` = "0 trophy", role = "img"), children = list(list("")))
Maryland
Atlantic
27
45
0.375
0
list(name = "div", attribs = list(title = "0 trophy", `aria-label` = "0 trophy", role = "img"), children = list(list("")))
Syracuse
Atlantic
26
56
0.317
0
list(name = "div", attribs = list(title = "0 trophy", `aria-label` = "0 trophy", role = "img"), children = list(list("")))
Duke
Coastal
40
106
0.274
1
list(name = "div", attribs = list(title = "0 trophy", `aria-label` = "0 trophy", role = "img"), children = list(list("")))
@dadgumboxscores | June 13, 2023 | data via sports-reference.com
1 2020 season did not use divisions (Notre Dame was 9-0 in conference play that season).
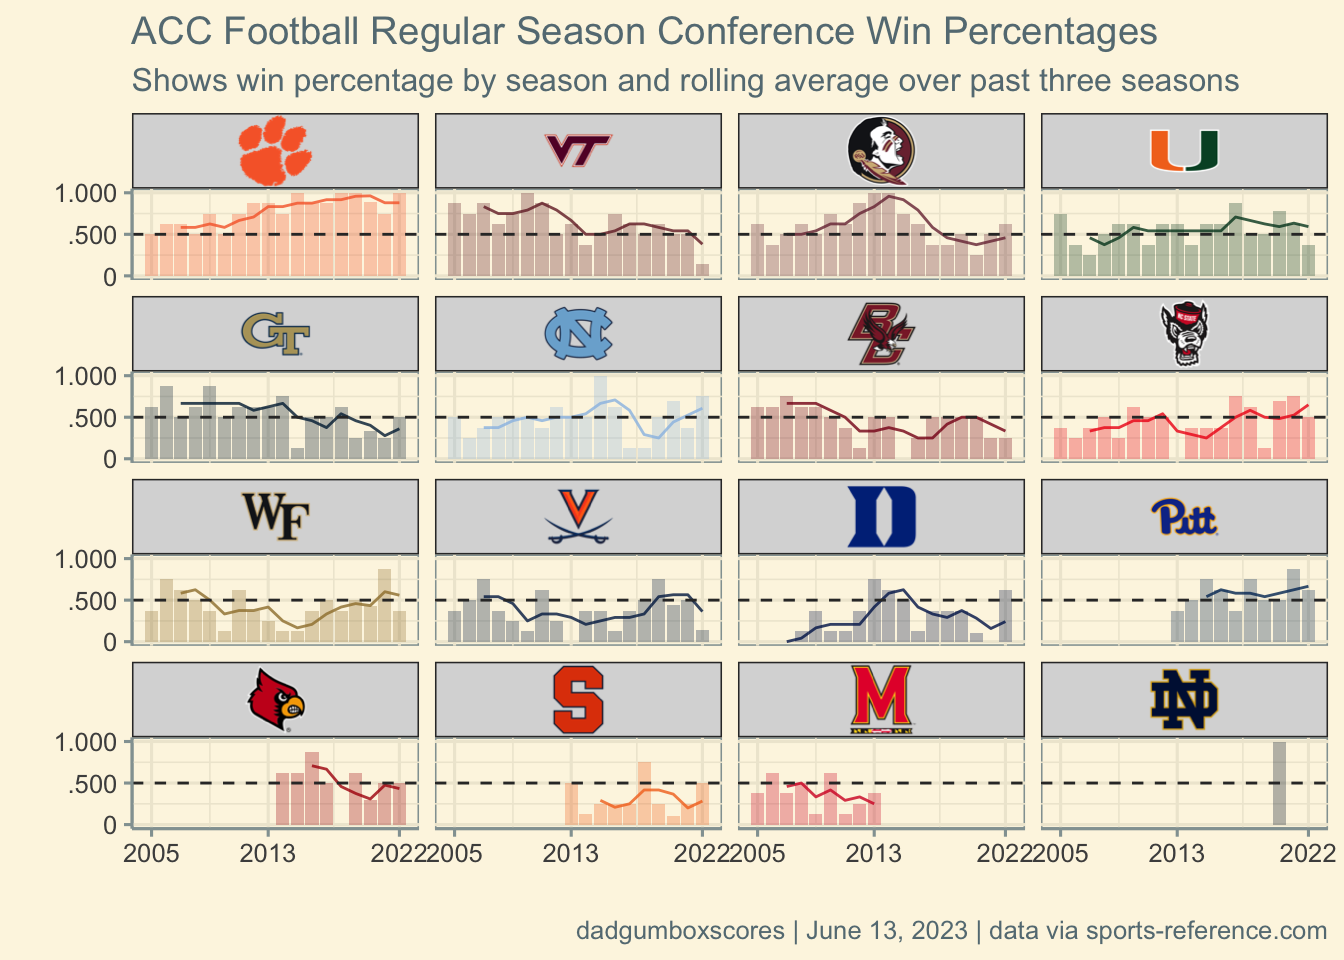
Make rolling mean plot
Code
# make plotroll_data <- dplyr::group_by(acc_hist, team) |> dplyr::arrange(year) |> dplyr::mutate(win_pct = win / (win + loss)) |> dplyr::mutate(avg_wp = zoo::rollmean( win_pct,k =3,fill =NA,align ='right' )) |> dplyr::ungroup()roll_data |> dplyr::mutate(team = forcats::fct_relevel( team,c("Clemson","Virginia Tech","Florida State","Miami","Georgia Tech","North Carolina","Boston College","NC State","Wake Forest","Virginia","Duke","Pittsburgh","Louisville","Syracuse","Maryland","Notre Dame" ) )) |> ggplot2::ggplot(ggplot2::aes(x = year, y = win_pct)) + ggplot2::geom_col(alpha =3/10,linetype =0, ggplot2::aes(fill = team)) + ggplot2::geom_line(ggplot2::aes(x = year, y = avg_wp, color = team)) + cfbplotR::scale_color_cfb(alpha = .8) + cfbplotR::scale_fill_cfb(alpha = .8) + ggplot2::facet_wrap( ~ team, nrow =4) + ggplot2::geom_hline(yintercept = .5,linetype ='dashed',color ="#333333") + ggplot2::scale_x_continuous(breaks =c(2005, 2013, 2022),labels =c("2005", "2013", "2022")) + ggplot2::scale_y_continuous(breaks =c(0, .5, 1.0),labels =c("0", ".500", "1.000")) + ggthemes::theme_solarized() + ggplot2::theme(strip.text = cfbplotR::element_cfb_logo(size =1),plot.title = ggtext::element_markdown(),plot.subtitle = ggtext::element_markdown(),text = ggplot2::element_text(family ="Arial"),panel.grid = ggplot2::element_blank() ) + ggplot2::labs(x ="",y ="",title ="ACC Football Regular Season Conference Win Percentages",subtitle ="Shows win percentage by season and rolling average over past three seasons",caption ="dadgumboxscores | June 13, 2023 | data via sports-reference.com" ) -> roll_plotroll_plot