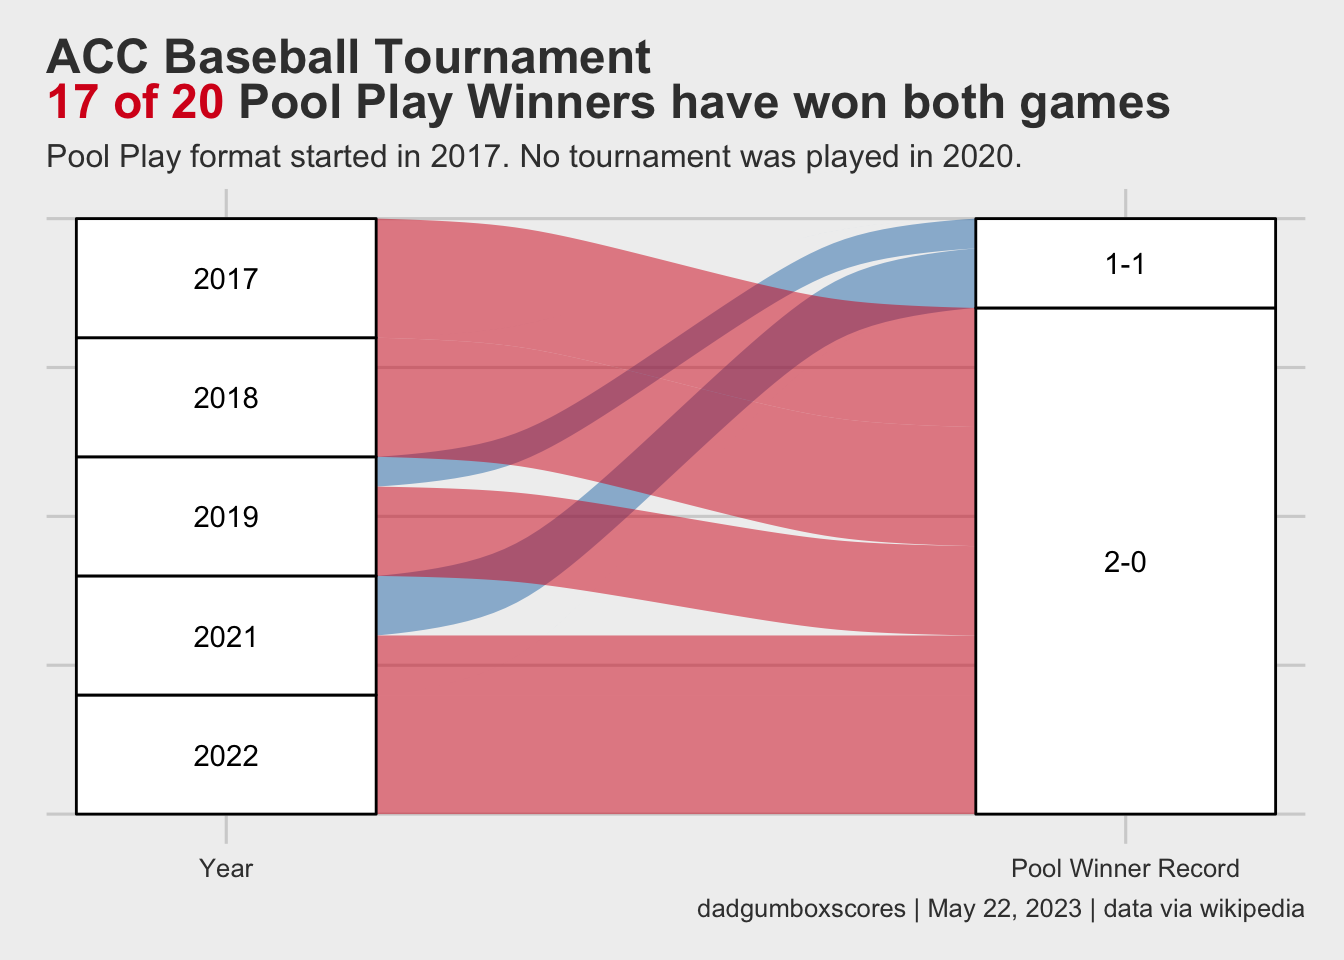
# make plot ggplot(data = pools,aes(axis1 = year, axis2 = type, y = freq)) +geom_alluvium(aes(fill = type)) +geom_stratum() +geom_text(stat ="stratum",aes(label =after_stat(stratum))) +scale_x_discrete(limits =c("Year", "Pool Winner Record"),expand =c(0.15, 0.05)) +scale_fill_manual(values =c("#2c7bb6", "#d7191c")) +theme_fivethirtyeight() +theme(plot.title =element_markdown(),plot.subtitle =element_markdown(),text =element_text(family ="Arial"),panel.grid =element_blank(),axis.text.y =element_blank(),legend.position ="none" ) +labs(title ="ACC Baseball Tournament \n<span style='color:#d7191c;'>17 of 20</span> Pool Play Winners have won both games",subtitle ="Pool Play format started in 2017. No tournament was played in 2020.",caption ="dadgumboxscores | May 22, 2023 | data via wikipedia" ) -> alluv_plot# save itggplot2::ggsave("alluv_plot.png", alluv_plot,w =8.5,h =6.5,dpi =600,type ='cairo')alluv_plot
Make scatter plot
Code
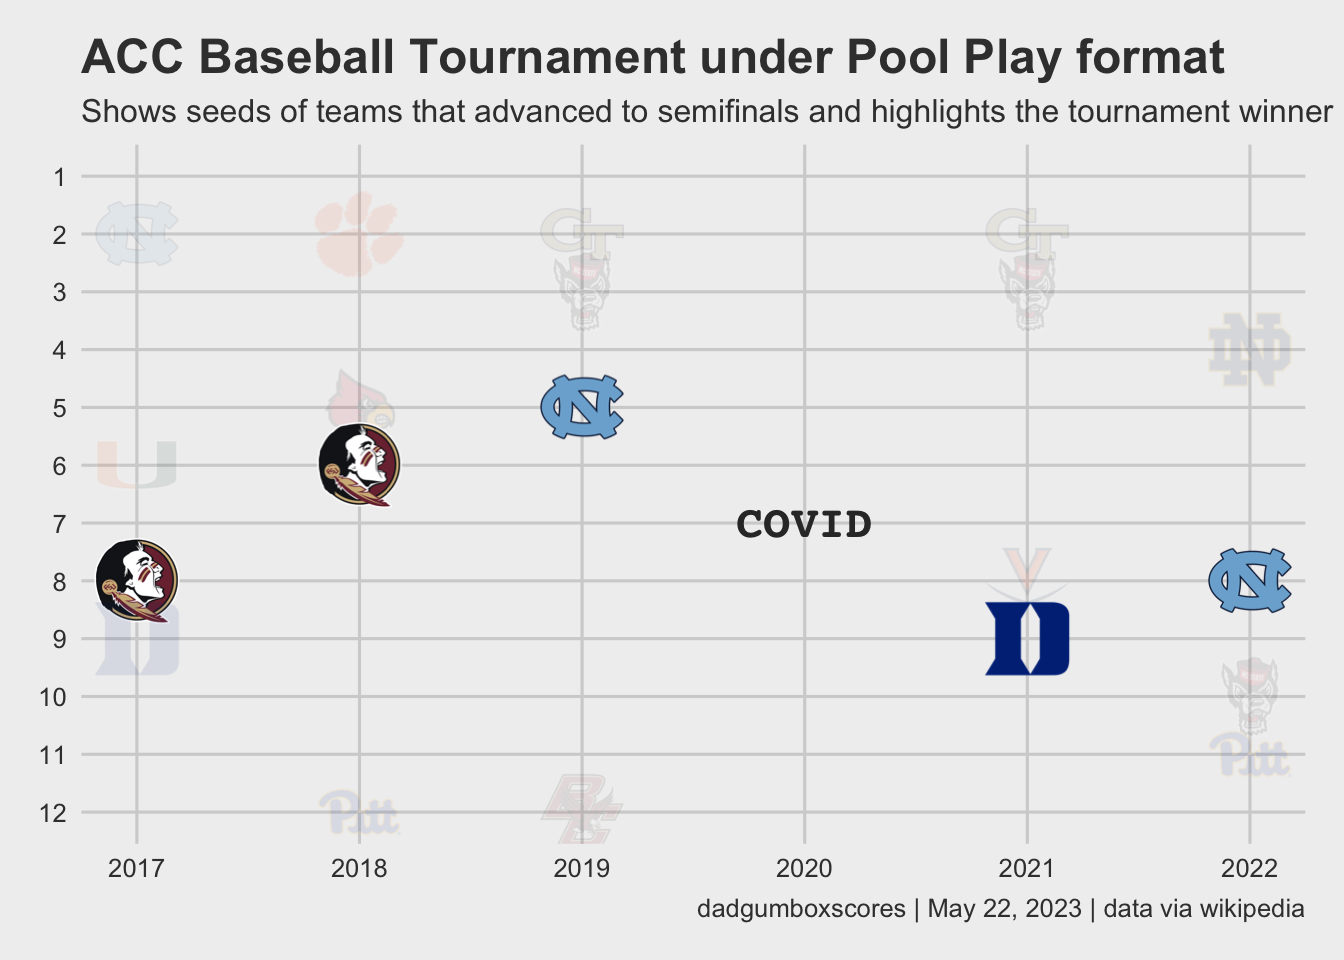
# odd tablepast_semis %>%mutate(alpha =if_else(win =="yes", 1, .9999)) %>%ggplot(aes(x = year, y = seed)) +geom_cfb_logos(aes(team = team, alpha = alpha), width =0.075) +scale_y_reverse(breaks =seq(1, 12, 1), limits =c(12, 1)) +scale_x_continuous(breaks =seq(2017, 2022, 1)) +theme_fivethirtyeight() +theme(plot.title =element_markdown(),plot.subtitle =element_markdown(),text =element_text(family ="Arial"),panel.grid =element_blank(), ) +labs(title ="ACC Baseball Tournament under Pool Play format",subtitle ="Shows seeds of teams that advanced to semifinals and highlights the tournament winner",caption ="dadgumboxscores | May 22, 2023 | data via wikipedia" ) +annotate(geom ="text",x =2020,y =7,color ="#333333",label ="COVID",size =6,fontface ='bold',family ='mono' ) -> scat_plot ggplot2::ggsave("scat_plot.png", scat_plot,w =8.5,h =8.5,dpi =600,type ='cairo')scat_plot