# load csv all_drafts <-read_csv("all_drafts.csv")# find top teams since 1994top_teams <- all_drafts %>%group_by(team) %>% count %>%arrange(-n) %>%filter(n >49) # find only acc teams acc_teams <-c("Miami (FL)", "North Carolina State", "Louisville", "Virginia", "Duke", "Virginia Tech", "North Carolina","Notre Dame", "Florida State", "Boston College", "Clemson", "Georgia Tech","Wake Forest", "Pittsburgh", "Syracuse")acc_recent <- all_drafts %>%filter(draft_year >2014) %>%filter(team %in% acc_teams) %>%group_by(team) %>% count %>%arrange(-n) # modify tier function cfb_team_tiers <-function(data,title ="CFB Team Tiers, 2021 as of Week 6",subtitle ="created with the #cfbplotR Tiermaker",caption =NULL,tier_desc =c("1"="Playoff","2"="Very Good","3"="Medium","4"="Bad","5"="What are they doing?","6"="","7"=""),presort =FALSE,alpha =0.8,width =0.042,no_line_below_tier =NULL,devel =FALSE){ rlang::check_installed("sjmisc", "to build the cfbplotR team tiers.") required_vars <-c("tier_no", "team")if (!all(required_vars %in%names(data))){ cli::cli_abort("The data frame {.var data} has to include the variables {.var {required_vars}}!") } bg <-"floral white" lines <-"#e0e0e0" tiers <-sort(unique(data$tier_no)) tierlines <- tiers[!tiers %in% no_line_below_tier] +0.5 tierlines <-c(min(tiers) -0.5, tierlines)if (isTRUE(presort)){ data <- data %>% dplyr::group_by(.data$tier_no) %>% dplyr::arrange(.data$team) %>% dplyr::mutate(tier_rank =1:dplyr::n()) %>% dplyr::ungroup() }if (!"tier_rank"%in%names(data)){ data <- data %>% dplyr::group_by(.data$tier_no) %>% dplyr::mutate(tier_rank =1:dplyr::n()) %>% dplyr::ungroup() } data$team <- cfbplotR::clean_school_names(as.character(data$team)) p <- ggplot2::ggplot(data, ggplot2::aes(y = .data$tier_no, x = .data$tier_rank)) + ggplot2::geom_hline(yintercept = tierlines, color = lines)if(isFALSE(devel)) p <- p + cfbplotR::geom_cfb_logos(ggplot2::aes(team = .data$team), width = width, alpha = alpha)if(isTRUE(devel))p <- p + ggplot2::geom_text(ggplot2::aes(label = .data$team), color ="#333333") p <- p + ggplot2::scale_y_continuous(expand = ggplot2::expansion(add =0.1),limits =rev(c(min(tiers) -0.5, max(tiers) +0.5)),breaks =rev(tiers),labels =function(x) sjmisc::word_wrap(tier_desc[x], 15),trans ="reverse" ) + ggplot2::labs(title = title, subtitle = subtitle, caption = caption) + ggplot2::theme_minimal(base_size =11.5) + ggplot2::theme(plot.title = ggplot2::element_text(color ="#333333", face ="bold"),plot.subtitle = ggplot2::element_text(color ="#8e8e93"),plot.caption = ggplot2::element_text(color ="#8e8e93", hjust =1),plot.title.position ="plot",axis.text.x = ggplot2::element_blank(),axis.text.y = ggplot2::element_text(color ="#333333", face ="bold", size = ggplot2::rel(1.1)),axis.title = ggplot2::element_blank(),panel.grid = ggplot2::element_blank(),plot.background = ggplot2::element_rect(fill = bg, color = bg),panel.background = ggplot2::element_rect(fill = bg, color = bg) ) +NULL p}
Build the tier charts
Code
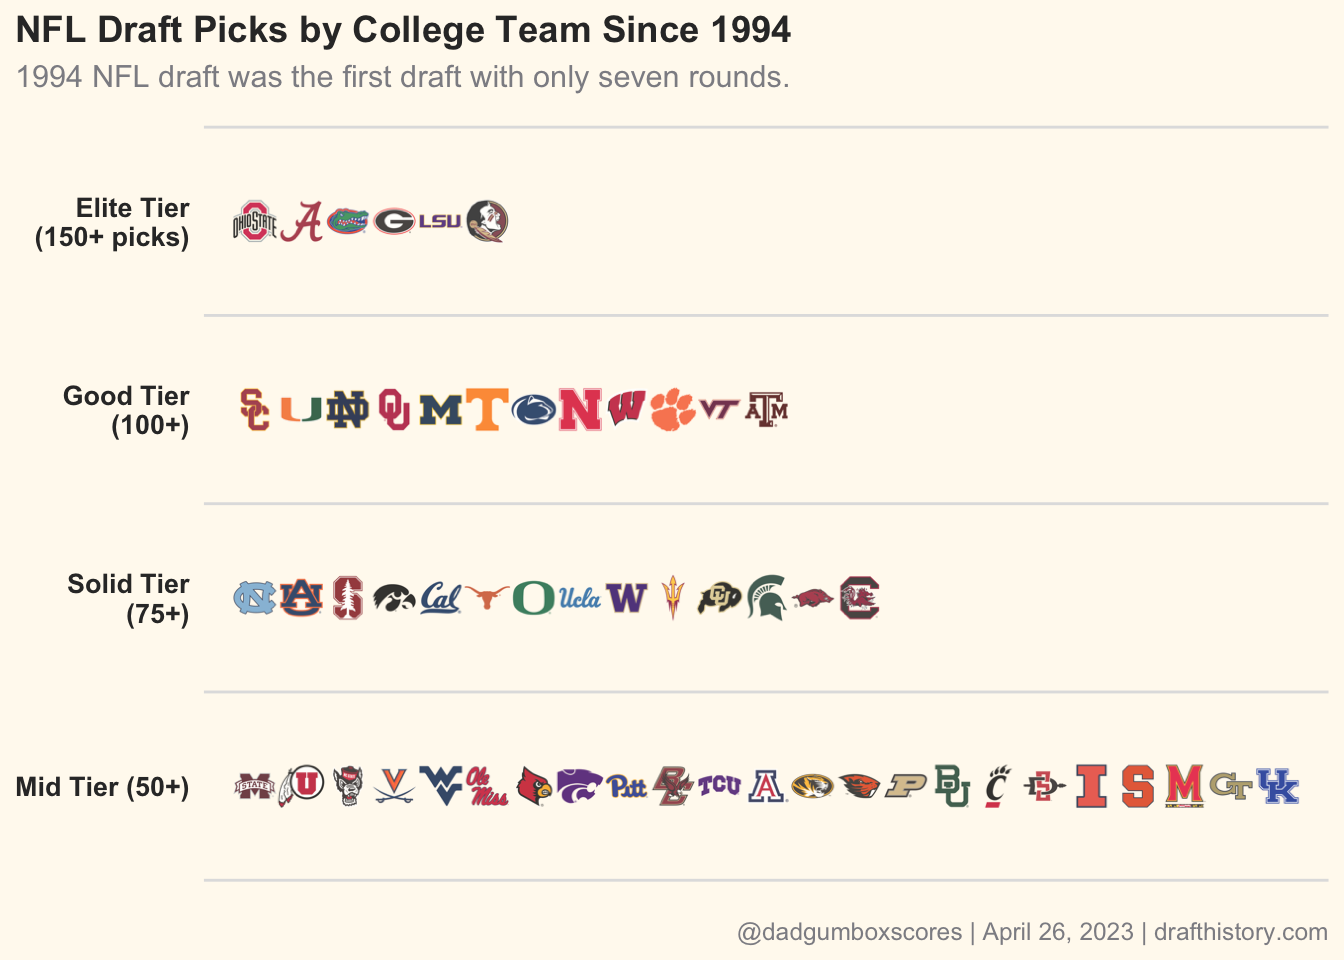
dft_pos <- top_teams %>%mutate(team =case_match(team,"Miami (FL)"~"Miami","Louisiana State"~"LSU","North Carolina State"~"NC State","Texas Christian"~"TCU", team ~ team)) %>%mutate(tier_no =case_when( n >150~1, n <149& n >99~2, n <100& n >74~3, n <75& n >50~4 )) %>%cfb_team_tiers(title ="NFL Draft Picks by College Team Since 1994",subtitle ="1994 NFL draft was the first draft with only seven rounds.",caption ="@dadgumboxscores | April 26, 2023 | drafthistory.com",tier_desc =c("1"="Elite Tier (150+ picks)","2"="Good Tier (100+)","3"="Solid Tier (75+)","4"="Mid Tier (50+)"), )# save itggsave("dft_pos_94.png", dft_pos,w =6,h =6,dpi =600,type ='cairo')dft_pos
Code
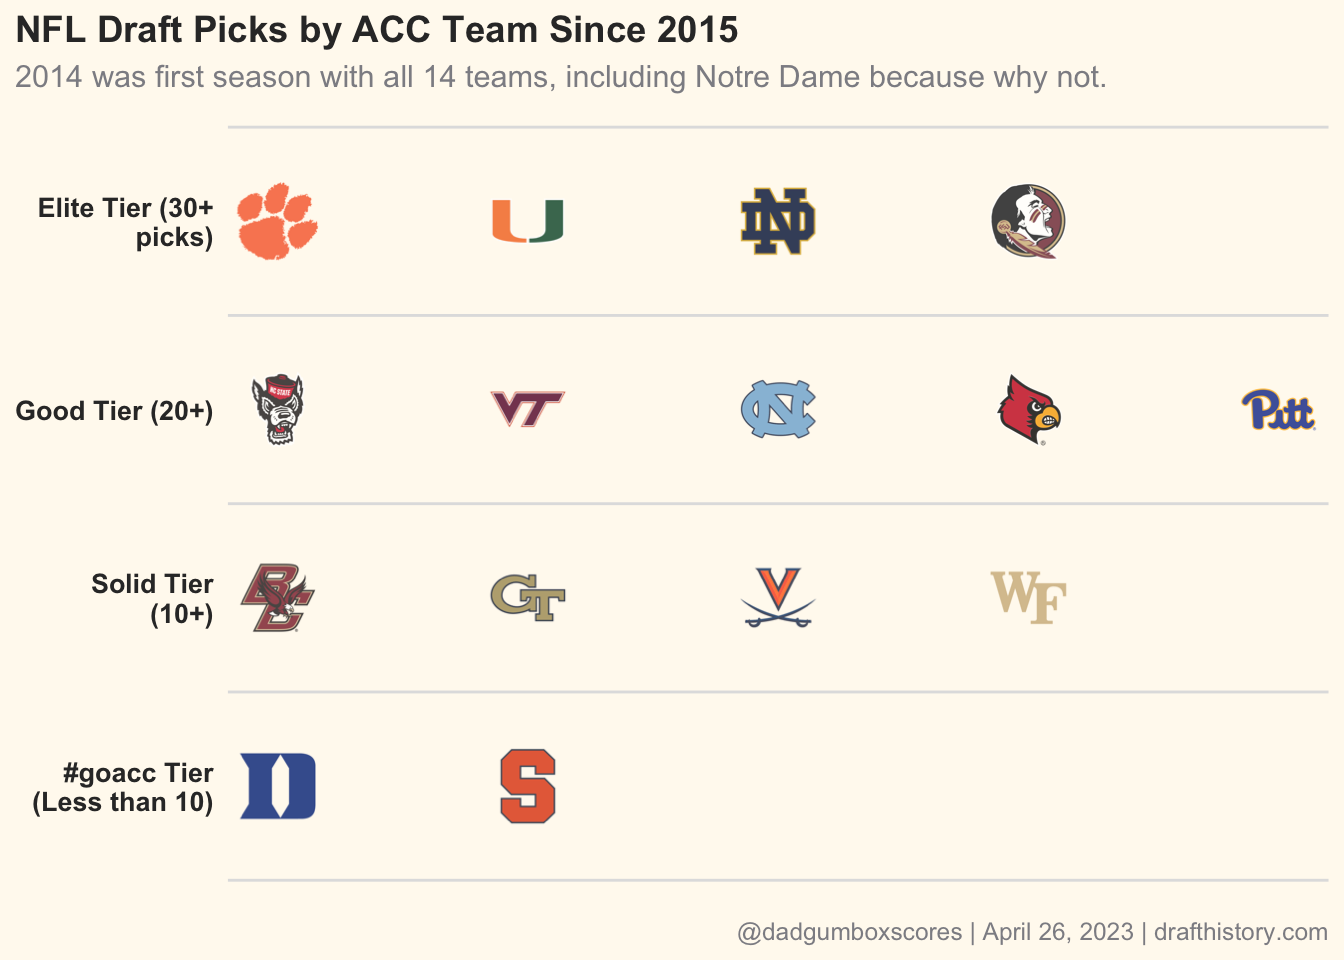
# now do acc teams since 2014acc_pos <- acc_recent %>%mutate(team =case_match(team,"Miami (FL)"~"Miami","North Carolina State"~"NC State", team ~ team)) %>%mutate(tier_no =case_when( n >30~1, n <30& n >19~2, n <20& n >9~3, n <10& n >0~4 )) %>%cfb_team_tiers(title ="NFL Draft Picks by ACC Team Since 2015",subtitle ="2014 was first season with all 14 teams, including Notre Dame because why not.",caption ="@dadgumboxscores | April 26, 2023 | drafthistory.com",width =0.075,tier_desc =c("1"="Elite Tier (30+ picks)","2"="Good Tier (20+)","3"="Solid Tier (10+)","4"="#goacc Tier (Less than 10)"), )# save itggsave("acc_pos_14.png", acc_pos,w =6,h =6,dpi =600,type ='cairo')acc_pos