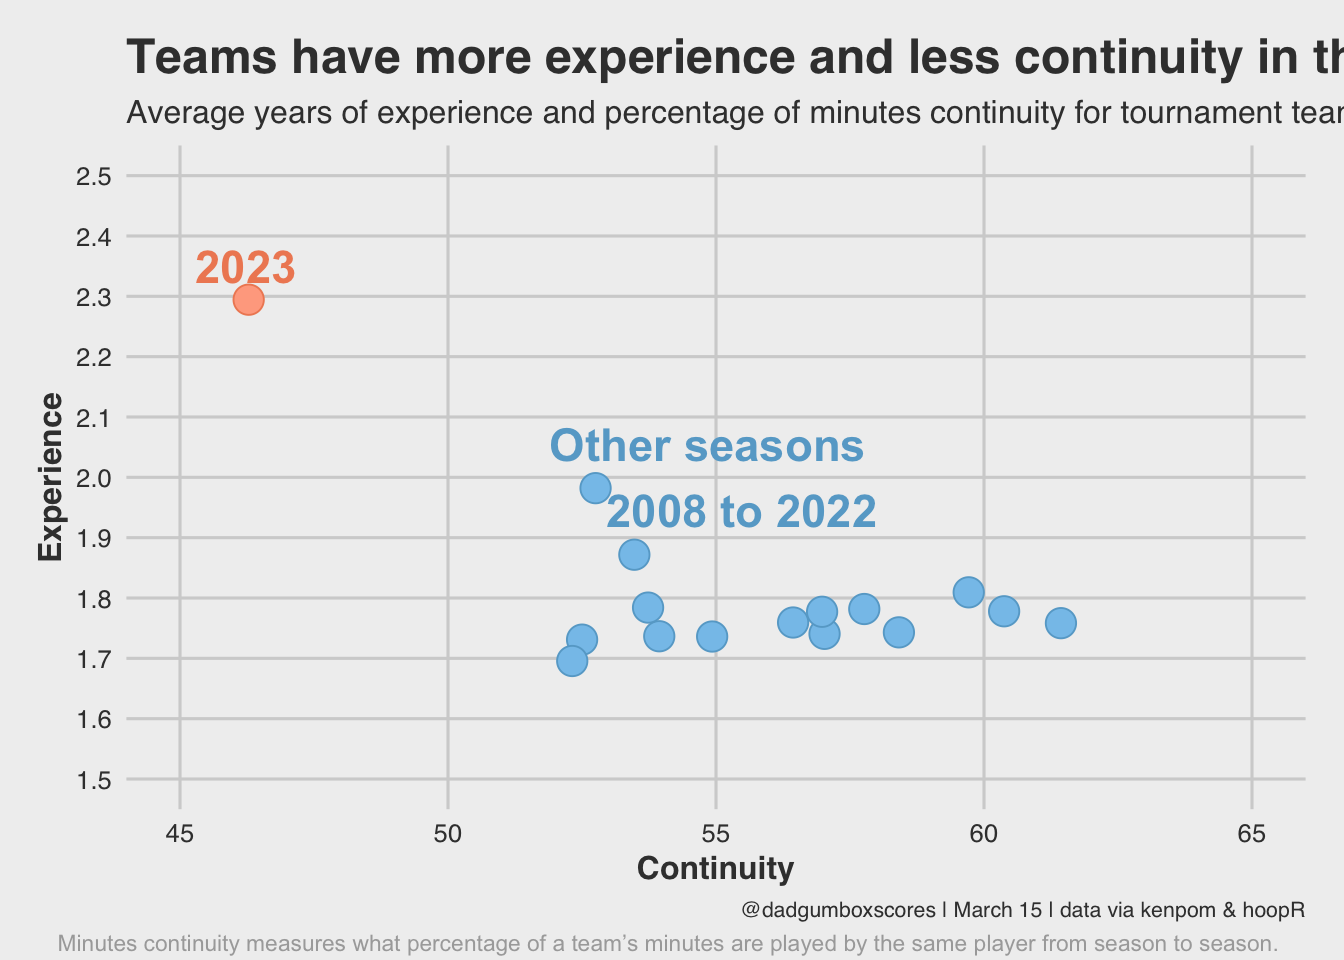
avgs_plot <- avgs %>%mutate(color =if_else(season ==2023, "#ef8a62", "#67a9cf"),fill = colorspace::lighten(color, amount =0.3) ) %>%ggplot(aes(x = avg_cont, y = avg_exp, color = color, fill = fill)) +geom_point(size =5, pch =21) +scale_color_identity(aesthetics =c("fill", "color")) +scale_x_continuous(limits =c(45, 65), breaks =seq(45, 65, by =5)) +scale_y_continuous(limits =c(1.5, 2.5), breaks =seq(1.5, 2.5, by = .1)) +coord_cartesian(clip ="off") +annotate("text", x =45, y =1.5, size =3, label ="Minutes continuity measures what percentage of a team’s minutes are played by the same player from season to season.", vjust =10.5, hjust =0.1, color ="darkgrey") +theme_fivethirtyeight() +theme(axis.title.x =element_text(face="bold"),axis.title.y =element_text(face="bold"),plot.caption =element_text(size =8)) +labs(x ="Continuity",y ="Experience",title ="Teams have more experience and less continuity in the NCAA Tournament",subtitle ="Average years of experience and percentage of minutes continuity for tournament teams since 2008.",caption ="@dadgumboxscores | March 15 | data via kenpom & hoopR" ) +annotate("text", y =2.35, x =46.8, color ="#ef8a62", label ="2023",size =6,fontface ="bold",hjust =0.8 ) +annotate("text", y =2, x =57, color ="#67a9cf", label ="Other seasons \n2008 to 2022",size =6,fontface ="bold",hjust =0.8 )ggsave("avg_plot.png", avgs_plot,w =10.5,h =8.5,dpi =600,type ='cairo')avgs_plot
Make GT Table
Code
acc_table <- acc_nums %>%filter(season !=2020) %>%gt() %>%cols_label(# rename columnsseason ="Year",team ="Team",ncaa_seed ="Seed",continuity ="% Min",experience ="Years",continuity_rk ="D-I Rank",experience_rk ="D-I Rank" ) %>%tab_spanner(label ="Continuity",columns =c(continuity, continuity_rk)) %>%tab_spanner(label ="Experience",columns =c(experience, experience_rk)) %>%gt_theme_dot_matrix() %>%tab_header(title ="Experience and Minutes Continuity for the Big Four") %>%tab_source_note(source_note ="@dadgumboxscores | March 15 | data via kenpom & hoopR") %>%tab_options (source_notes.font.size =px(10),row.striping.background_color ='#ffffed',table.font.size =px(10),column_labels.text_transform ='capitalize' )gtsave_extra(acc_table,"acc_table.png")acc_table
Experience and Minutes Continuity for the Big Four
Year
Team
Seed
Continuity
Experience
% Min
D-I Rank
Years
D-I Rank
2023
Duke
5
15.8
337
1.34
295
2023
NC State
11
36.2
232
2.64
44
2022
Duke
2
39.8
231
0.96
347
2022
UNC
8
58.9
100
1.76
212
2021
UNC
8
47.0
159
1.19
263
2019
Duke
1
21.8
327
0.33
351
2019
UNC
1
59.2
89
1.65
127
2018
Duke
2
18.7
339
0.89
317
2018
UNC
2
40.8
246
1.62
142
2018
NC State
9
35.2
276
2.09
42
2017
Duke
2
49.5
180
1.70
118
2017
UNC
1
64.4
51
1.87
75
2017
Wake Forest
11
53.3
141
1.85
78
2016
Duke
4
23.6
334
0.75
328
2016
UNC
1
75.7
12
1.97
54
2015
UNC
4
65.6
56
1.47
180
2015
NC State
8
51.1
160
1.78
103
2015
Duke
1
38.1
266
1.28
235
2014
NC State
12
20.0
340
0.93
315
2014
Duke
3
48.4
207
1.57
161
2014
UNC
6
55.9
140
1.18
274
2013
NC State
8
61.9
83
2.33
12
2013
UNC
8
34.0
294
1.20
245
2013
Duke
2
59.0
110
2.01
50
2012
UNC
1
70.2
35
1.47
178
2012
NC State
11
66.4
54
2.20
25
2012
Duke
2
61.4
88
1.56
151
2011
UNC
2
34.8
303
0.86
314
2011
Duke
1
58.3
122
2.08
50
2010
Duke
1
61.2
110
2.34
17
2010
Wake Forest
9
62.9
95
2.14
29
2009
Wake Forest
4
75.3
18
1.70
109
2009
Duke
2
73.5
23
2.05
39
2009
UNC
1
67.7
50
2.35
13
2008
UNC
1
66.6
60
1.69
109
2008
Duke
2
67.5
55
1.67
116
@dadgumboxscores | March 15 | data via kenpom & hoopR