021: Conference SOS

gt table
Published

March 11, 2023

Load data

Code
 # function from hoopR to fetch data
 acc <- c("North Carolina", "Duke", "Wake Forest", "N.C. State", "Pittsburgh",
        "Virginia Tech", "Georgia Tech", "Notre Dame", "Virginia",  "Boston College",
        "Louisville", "Syracuse", "Clemson", "Florida St.", "Miami FL")

 acc_team <- function(id) {
 kp_team_schedule(team = id, year = 2023)
 }

 # function to get ACC games 
 teams_acc <- lapply(acc, acc_team)

# build table of only conference games
 acc_results_2023 <- as.data.frame(do.call(rbind, teams_acc)) %>%
           mutate(conference_game = if_else(postseason == "Atlantic Coast Conference Tournament", TRUE, conference_game)) %>%
           filter(conference_game == TRUE) %>%
           mutate(full_result = str_split(result, ",", simplify = T),
           points_for = str_split(full_result[,2], "-", simplify = T),
           fr = full_result[,1],
           pf = points_for[,1],
           pa = points_for[,2]) %>%
           select(game_date, game_id, team, opponent, opponent_rk, location, fr, pf, pa) %>%
           mutate(diff = as.numeric(pf) - as.numeric(pa),
                     year = 2023) %>%
           rename(result = fr, points_scored = pf, points_allowed = pa) 

# find wins and losses
wins_losses <- acc_results_2023 %>% 
       group_by(team, result) %>% 
       summarise(total = n()) %>% 
       pivot_wider(names_from = result, values_from = total)

# find opp count
opps <- acc_results_2023 %>% 
       group_by(team, opponent, opponent_rk) %>% 
       summarise(total = n())

# fix it up for uva and duke
opps$total[opps$team == 'Duke' & opps$opponent == 'Virginia'] <- 3

opps$total[opps$team == 'Virginia' & opps$opponent == 'Duke'] <- 3

# find the opponent ranking 
opp_rk <- opps %>% 
       mutate(agg_rk = (opponent_rk * total)) %>%
       group_by(team) %>% 
       summarise(opp_rk = mean(agg_rk)) %>%
       mutate(rk = dense_rank(desc(-opp_rk))) %>%
     mutate(team = if_else(team == "N.C. State", "NC State", team))

# combine table
full_acc_sos <- merge(opp_rk, wins_losses, by = "team") %>%
                select(team, W, L, opp_rk) 

# net ratings function 
net_ranks <- function(url) {
  
  net_page <- read_html(url)
  
  net_rk <- net_page %>%
    html_nodes("table") %>%
    .[1] %>%
    html_table(fill = TRUE)
  
  net_table <- as.data.frame(net_rk)  

  net_table <- net_table %>%   
    mutate(date = gsub("[^0-9.-]", "", colnames(net_table[3]))) %>% 
    mutate(date = str_sub(date, end = -2)) %>%
    mutate(record = str_split(WL, "-", simplify = T),
           wins = record[,1],
           losses = record[,2],
           conf_record = str_split(Conf..Record, "-", simplify = T),
           wins_conf = conf_record[,1],
           losses_conf = conf_record[,2],
           non_conf_record = str_split(Non.Conference.Record, "-", simplify = T),
           wins_non_conf = non_conf_record[,1],
           losses_non_conf = non_conf_record[,2],
           first_q = str_split(Quadrant.1, "-", simplify = T),
           q1_win = first_q[,1],
           q1_loss = first_q[,2],
           second_q = str_split(Quadrant.2, "-", simplify = T),
           q2_win = second_q[,1],
           q2_loss = second_q[,2],
           third_q = str_split(Quadrant.3, "-", simplify = T),
           q3_win = third_q[,1],
           q3_loss = third_q[,2],
           fourth_q = str_split(Quadrant.4, "-", simplify = T),
           q4_win = fourth_q[,1],
           q4_loss = fourth_q[,2],
    ) %>% 
    rename(team = Team, conf = Conference, net = NET, prev_net = Prev.NET, 
           sos = NET.SOS, non_conf_sos = NET.NonConf.SOS) %>% 
    select(team, conf, net, prev_net, sos, non_conf_sos, wins, 
           losses, wins_non_conf, losses_non_conf, q1_win, q1_loss, 
           q2_win, q2_loss, q3_win, q3_loss, q4_win, q4_loss, date) %>% 
    mutate_at(vars(-team, -conf, -date), as.numeric)

}

net <- net_ranks(url = "https://stats.ncaa.org/selection_rankings/nitty_gritties/30928")

# find net ratings 
acc_non_sos <- net %>% filter(conf == "ACC") %>% 
        arrange(non_conf_sos) %>% 
        select(team, non_conf_sos) %>%
        mutate(team = if_else(team == "Miami (FL)", "Miami FL", team)) 

# combine two
sos_two <- merge(opp_rk, acc_non_sos, by = "team") %>%
                select(team, rk, opp_rk, non_conf_sos) 

Set the theme for the plot

Code
# theme
  theme_me <- function () {
    theme_minimal(base_size = 10, base_family = "RobotoCondensed-Regular") %+replace%
      theme (
        plot.title = element_text(
          hjust = 0.5,
          size = 24,
          face = "bold"
        ),
        plot.subtitle = element_text(
          hjust = 0.5,
          size = 10,
          lineheight = 0.25,
          vjust = -0.5
        ),
        plot.caption = element_text(
          hjust = 1,
          size = 6,
          lineheight = 0.35,
          margin = margin(t = 20)
        ),
        panel.grid.minor = element_blank(),
        plot.background = element_rect(fill = "floral white", color = "floral white")
      )
  }

Create GT Table

Code
sos_table <- full_acc_sos %>%
    arrange(opp_rk) %>%
  mutate(row_number = 1:n(), logo = team) %>%
  relocate(logo, .before = team) %>%
  gt() %>%
  cols_label(# rename columns
    row_number = "",
    logo = "",
    team = "Team",
    opp_rk = "SOS") %>%
  gt_fmt_cfb_logo(columns = "logo") %>%
    fmt_number(columns = opp_rk,
             decimals = 2,
             use_seps = FALSE) %>%
    data_color(
    columns = c(row_number),
    colors = scales::col_numeric(
      c(
        "#0a4c6a",
                 "#73bfe2",
                 "#cfe8f3",
                 "#fff2cf",
                 "#fdd870",
                 "#fdbf11",
                 "#ca5800"
      ),
      domain = NULL
    )
  ) %>%
  tab_header(title = "ACC: Conference Strength of Schedule",) %>%
  tab_source_note(source_note = "@dadgumboxscores | March 11, 2023 | data via kenpom")  %>%
  # adjust font sizes
  tab_options (source_notes.font.size = px(10),
               table.font.size = px(12),
  ) %>%
  # add theme using excel
  gt_theme_excel()

gtsave_extra(sos_table,
             "sos_table.png",
             vwidth = 650,
             vheight = 650)

sos_table
ACC: Conference Strength of Schedule
Team W L SOS
Louisville 2 19 150.29 1
Virginia Tech 9 13 159.21 2
Wake Forest 11 11 159.64 3
North Carolina 12 10 160.00 4
Florida St. 7 14 162.43 5
Duke 17 6 163.07 6
Syracuse 10 11 164.64 7
Boston College 10 12 165.64 8
Notre Dame 3 18 168.00 9
Miami FL 16 6 174.64 10
Georgia Tech 7 15 181.14 11
Clemson 15 7 182.57 12
Pittsburgh 15 7 187.36 13
Virginia 17 6 191.36 14
@dadgumboxscores | March 11, 2023 | data via kenpom

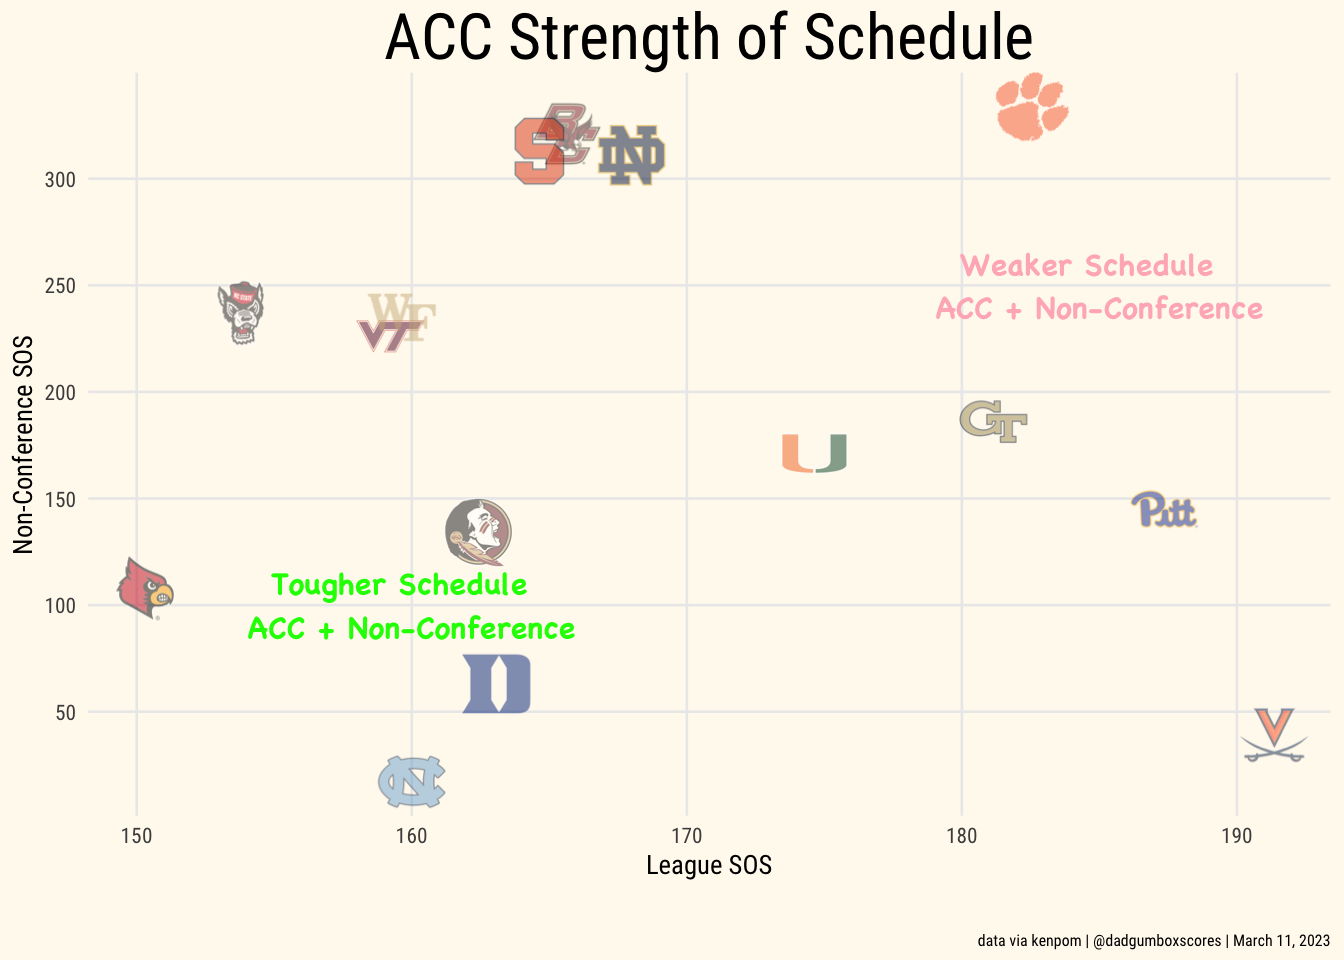
Scatterplot

Code
acc_sos <- sos_two  %>%
  ggplot(aes(x = opp_rk, y = non_conf_sos)) +
  geom_cfb_logos(aes(team = team), width = 0.060, alpha = 0.5) +
  scale_y_continuous(breaks = seq(0, 350, 50)) + 
 theme_me() +
  theme(legend.position = "top", plot.title = element_markdown()) +
  labs(
    title = "ACC Strength of Schedule",
    x = "League SOS",
    y = "Non-Conference SOS",
    caption = "data via kenpom | @dadgumboxscores | March 11, 2023"
  ) +
  annotate(
    "text",
    x = 160,
    y = 100,
    label = "Tougher Schedule  \nACC + Non-Conference",
    family = "Chalkboard Bold",
    size = 4,
    fontface = "bold",
    color = "green"
  ) +
  annotate(
    "text",
    x = 185,
    y = 250,
    label = "Weaker Schedule  \nACC + Non-Conference",
    family = "Chalkboard Bold",
    size = 4,
    fontface = "bold",
    color = "lightpink"
  ) 

ggsave(
  "sos_plot.png",
  acc_sos,
  w = 6.5,
  h = 6.5,
  dpi = 600,
  type = 'cairo'
)

acc_sos