015: NIL

gt tables
Published

February 10, 2023

Make data

Code
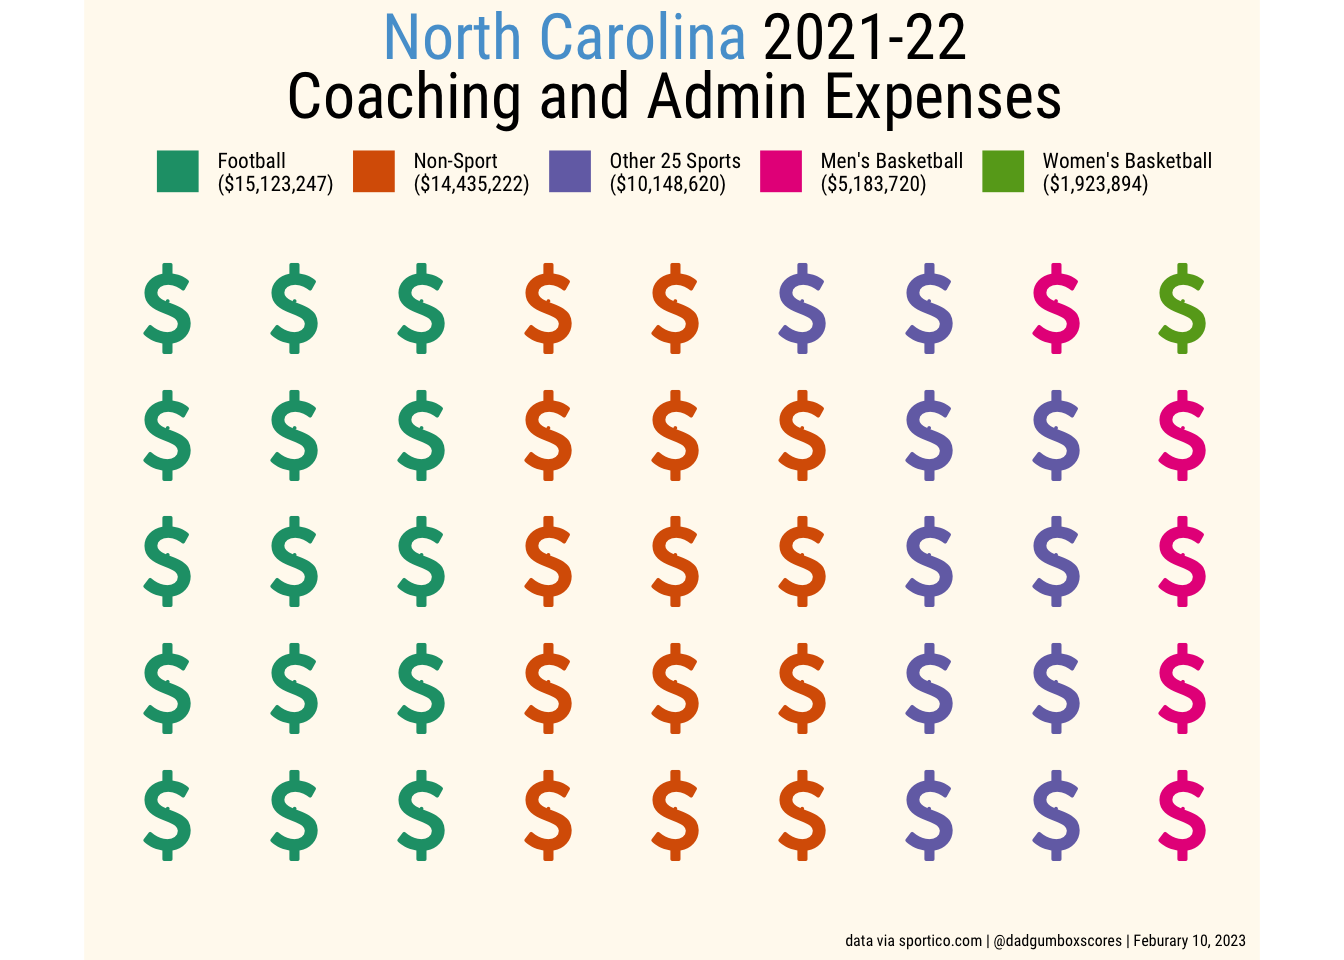
# load data from sportico 
# https://www.sportico.com/business/commerce/2021/college-sports-finances-database-intercollegiate-1234646029/
  
sportico <- tibble::tribble(
~cat,~admin,~coach,
"Football",4199529,10923718,
"Men's Basketball",1746733,3436987,
"Women's Basketball",449249,1474645,
"Other 25 Sports",574904,9573716,
"Non-Sport",14435222,0
)

# combine the two expenses into one table 
exp <- sportico %>% 
       mutate(total = admin + coach) %>% 
       select(cat, total)

Set the themes for the waffle plot

Code
# theme
  theme_me <- function () {
    theme_minimal(base_size = 10, base_family = "RobotoCondensed-Regular") %+replace%
      theme (
        plot.title = element_text(
          hjust = 0.5,
          size = 24,
          face = "bold"
        ),
        plot.subtitle = element_text(
          hjust = 0.5,
          size = 10,
          lineheight = 0.25,
          vjust = -0.5
        ),
        plot.caption = element_text(
          hjust = 1,
          size = 6,
          lineheight = 0.35,
          margin = margin(t = 20)
        ),
        panel.grid.minor = element_blank(),
        plot.background = element_rect(fill = "floral white", color = "floral white")
      )
  }

Make gt table

Code
exp_table <- exp %>%
  arrange(-total) %>%
  gt() %>%
  cols_label(# rename columns
    cat = "Sport",
    total = "Expenses") %>%
  fmt_currency(columns = total,
               currency = "USD",
               decimals = 0) %>%
  gt_theme_guardian() %>%
  tab_header(title = md("North Carolina: 2021-22 Coaching and Admin Expenses")) %>%
  tab_source_note(source_note = "@dadgumboxscores | February 10, 2023 | data via sportico.com") %>%
  tab_options (source_notes.font.size = px(10),
               table.font.size = px(10),
  )

gtsave_extra(exp_table,
             "exp.png",
             vwidth = 390,
             vheight = 390)

exp_table
North Carolina: 2021-22 Coaching and Admin Expenses
Sport Expenses
Football $15,123,247
Non-Sport $14,435,222
Other 25 Sports $10,148,620
Men's Basketball $5,183,720
Women's Basketball $1,923,894
@dadgumboxscores | February 10, 2023 | data via sportico.com

Make the waffle chart

Code
# convert exp to list form
exp_list <- c(
  `Football\n($15,123,247)` = 15.4,
  `Non-Sport\n($14,435,222)` = 14.4,
  `Other 25 Sports\n($10,148,620)` = 10.1,
  `Men's Basketball\n($5,183,720)` = 5.1,
  `Women's Basketball\n($1,923,894)` = 1.9
)

exp_waf <- waffle(
  exp_list,
  rows = 5.3,
  size = 1,
  use_glyph = "dollar",
  legend_pos = "bottom",
  colors = c("#1b9e77", "#d95f02", "#7570b3", "#e7298a", "#66a61e")
) +
  theme_me() +
  theme(
    panel.grid = element_blank(),
    axis.ticks.y = element_blank(),
    axis.ticks.x = element_blank(),
    axis.text.x = element_blank(),
    axis.text.y = element_blank()
  ) +
  guides(fill = guide_legend()) +
  theme(legend.position = "top", plot.title = element_markdown()) +
  labs(
    title = "<span style='color:#56a0d3;'>North Carolina</span> 2021-22  \nCoaching and Admin Expenses",
    x = NULL,
    y = NULL,
    caption = "data via sportico.com | @dadgumboxscores | Feburary 10, 2023"
  )


# save image of plot
ggsave(
  "exp_waf.png",
  exp_waf,
  w = 7,
  h = 7,
  dpi = 300,
  type = 'cairo'
)

exp_waf