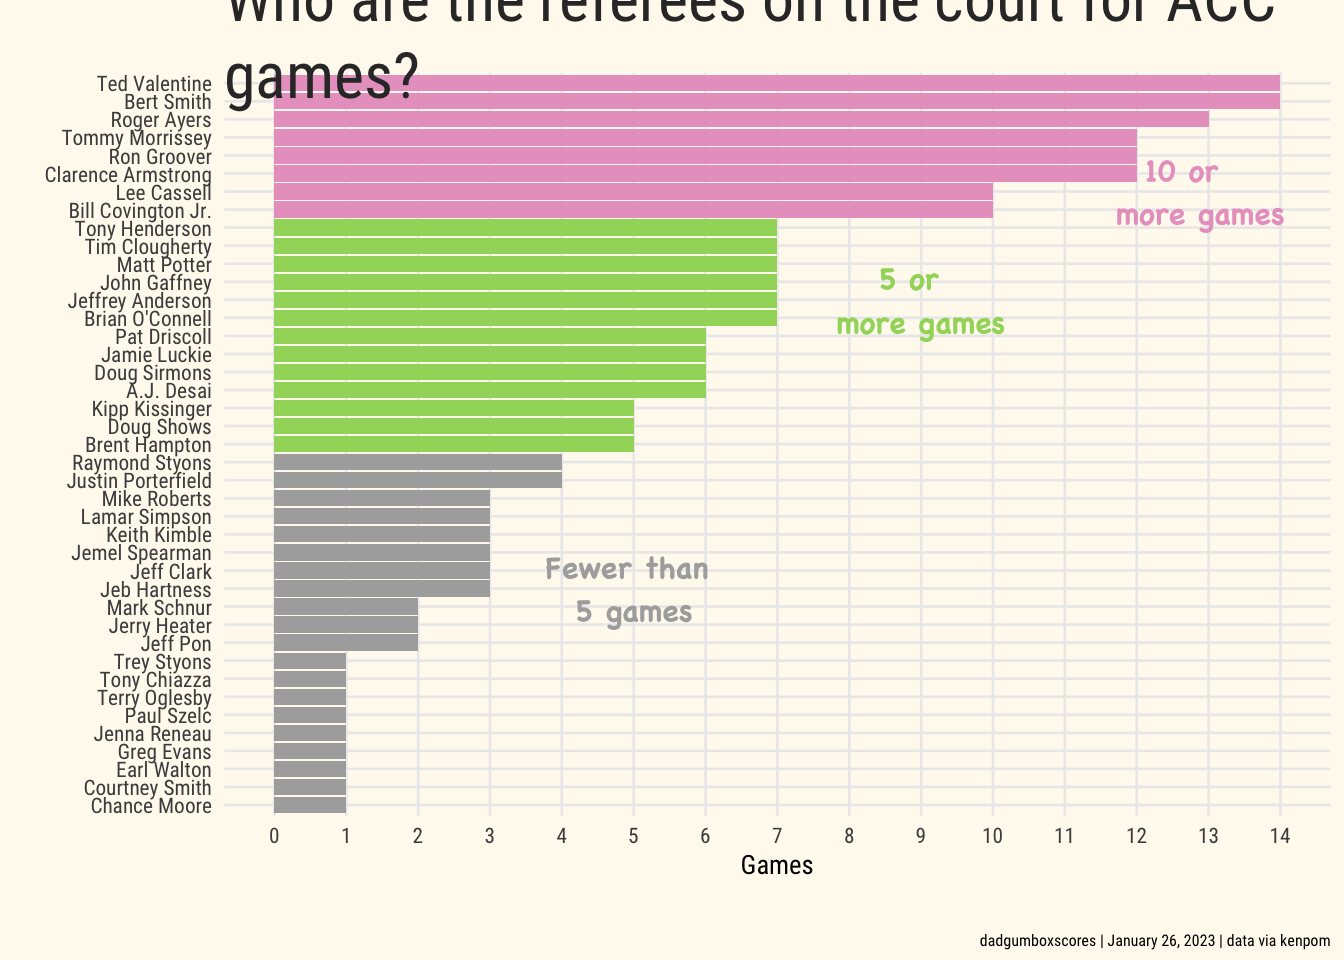
ref_plot <- full %>%
  mutate(referee_name = factor(referee_name, levels = .$referee_name)) %>%
  mutate(color = case_when(count > 9 ~ "#e9a3c9",
                           count > 4 ~ "#a1d76a",
                           ## all others should be gray
                           TRUE ~ "#acacac")) %>%
  ggplot(aes(count, referee_name, fill = color)) +
  geom_col() +
  scale_x_continuous(breaks = seq(0, 14, 1), limits = c(0, 14)) +
  labs(
    x = "Games",
    y = "",
    title = "<span style='color:#333333;'>Who are the *referees* on the court for ACC games? </span>",
    caption = "dadgumboxscores | January 26, 2023 | data via kenpom"
  ) +
  theme_me() +
  scale_fill_identity(guide = "none") +
  theme(plot.title = element_textbox_simple()) +
  annotate(
    "text",
    x = 12.8,
    y = 35,
    label = "10 or  \n more games",
    family = "Chalkboard Bold",
    size = 4,
    fontface = "bold",
    color = "#e9a3c9",
  ) +
  annotate(
    "text",
    x = 9,
    y = 29,
    label = "5 or  \nmore games",
    family = "Chalkboard Bold",
    size = 4,
    fontface = "bold",
    color = "#a1d76a",
  ) +
  annotate(
    "text",
    x = 5,
    y = 13,
    label = "Fewer than \n5 games",
    family = "Chalkboard Bold",
    size = 4,
    color = "#acacac",
    fontface = "bold",
  )

# save it
ggsave(
  "ref.png",
  ref_plot,
  w = 6.5,
  h = 8,
  dpi = 300,
  type = 'cairo'
)


ref_plot
