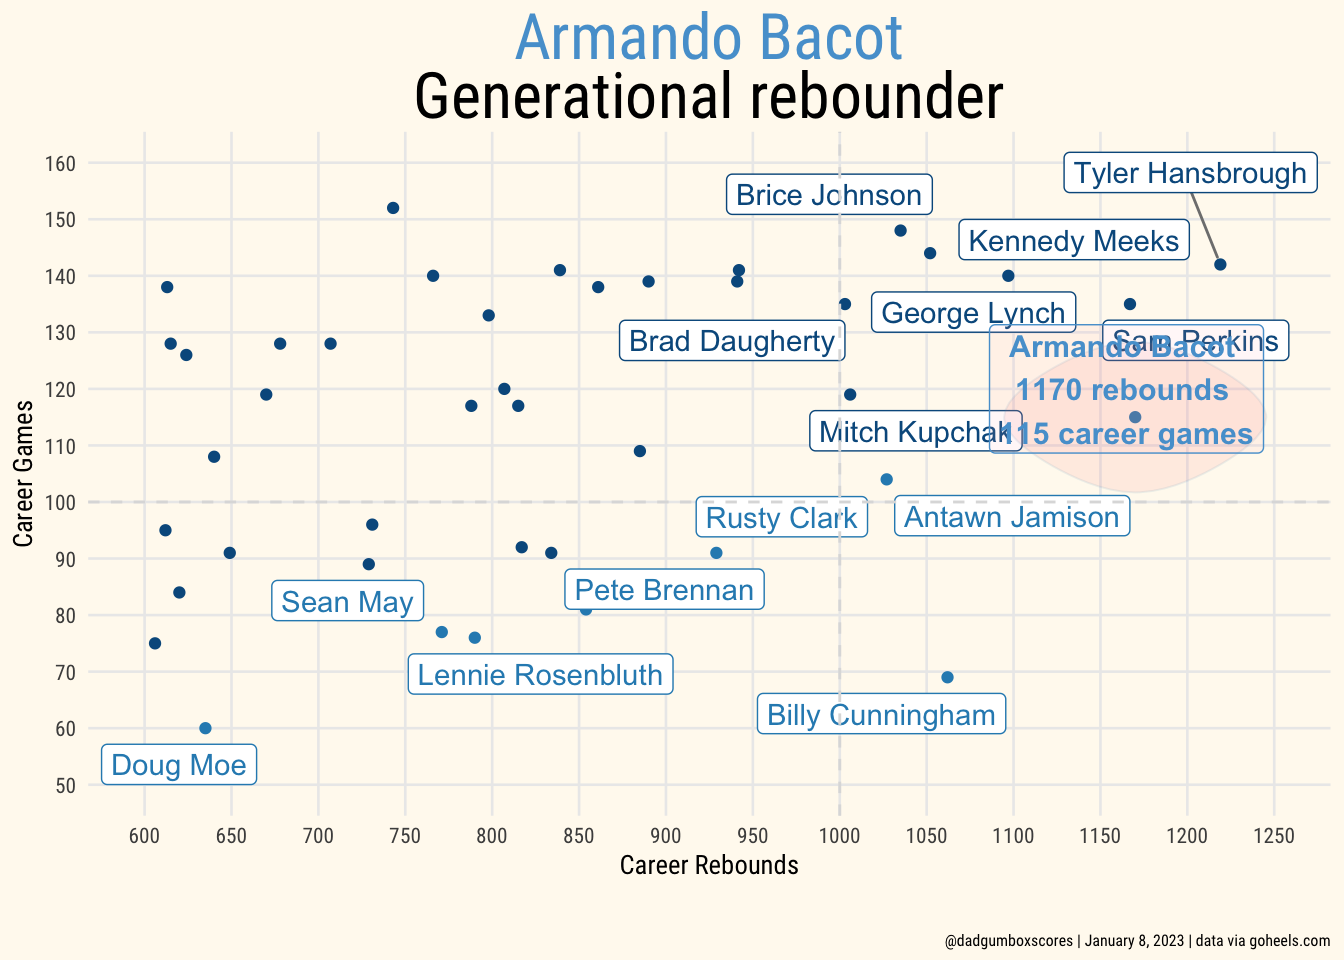
Code
rbs <- read_csv("unc_boards.csv") %>%
       filter(Rebounds > 600) %>%
       mutate(Type = if_else(RPG > 9.8, "Over 10.0 avg", "Under 10 avg"),
Label = if_else(RPG > 9.8 | Rebounds > 1000, Player, "")) January 8, 2023
# theme
theme_me <- function () {
  theme_minimal(base_size = 10, base_family = "RobotoCondensed-Regular") %+replace%
    theme (
      plot.title = element_text(
        hjust = 0.5,
        size = 24,
        face = "bold"
      ),
      plot.subtitle = element_text(
        hjust = 0.5,
        size = 10,
        lineheight = 0.25,
        vjust = -0.5
      ),
      plot.caption = element_text(
        hjust = 1,
        size = 6,
        lineheight = 0.35,
        margin = margin(t = 20)
      ),
      panel.grid.minor = element_blank(),
      plot.background = element_rect(fill = "floral white", color = "floral white")
    )
}

colors = c("#2b8cbe", "#045a8d")bacot <- rbs %>%
mutate(Label = if_else(Player == "Armando Bacot", "", Label)) %>%
ggplot(aes(x=Rebounds, y = Games, color=Type)) +
geom_point() +
geom_label_repel(aes(label = Label),
box.padding = 0.35,
point.padding = 0.5,
segment.color = 'grey50') +
geom_vline(xintercept = 1000,
linetype = 'dashed',
color = "#dddddd") +
geom_hline(yintercept = 100,
linetype = 'dashed',
color = "#dddddd") +
scale_color_manual(values = colors) +
scale_x_continuous(breaks = seq(600, 1250, 50), limits = c(600, 1250)) +
scale_y_continuous(breaks = seq(50, 160, 10), limits = c(50, 160)) +
geom_encircle(data = filter(rbs,
Player == "Armando Bacot"), aes(fill = "lightpink"),
s_shape=0.2, expand=0.01, alpha=0.1) +
theme_me() +
theme(legend.position = "none", plot.title = element_markdown()) +
labs(
y = "Career Games",
x = "Career Rebounds",
title = "<span style='color:#56a0d3'>Armando Bacot</span> \nGenerational rebounder ",
caption = "@dadgumboxscores | January 8, 2023 | data via goheels.com"
) +
annotate(
geom = 'label',
y = 120,
x = 1165,
label = "Armando Bacot \n1170 rebounds \n115 career games",
fontface = 'bold',
colour = "#56a0d3",
size = 4,
fill = "lightpink",
alpha = 0.1
)
# save the chart
ggsave(
"bacot.png",
bacot,
w = 9.5,
h = 9.5,
dpi = 300,
)
bacot
table <- rbs %>%
  filter(Rebounds > 1000 | RPG > 9.8) %>%
  mutate(Years = if_else(Player == "Armando Bacot", "2019-present", Years)) %>%
  select(Player, Years, Rebounds, Games, RPG) %>%
  arrange(-Rebounds) %>%
  gt() %>%
  gt_merge_stack(col1 = Player, col2 = Years) %>%
  gt_highlight_rows(
    rows = c(2),
    fill = "#d0e4f3",
    bold_target_only = TRUE,
    target_col = c(RPG),
  ) %>%
  gt_theme_nytimes() %>%
  # set title + caption + subtitle
  tab_header(title = "North Carolina Career Rebound Leaders") %>%
  tab_source_note(source_note = "@dadgumboxscores | January 8, 2023 | data via goheels.com")  %>%
  # fix font of source note
  tab_options (source_notes.font.size = px(10),
               table.font.size = px(12))

gtsave(table, 'rpg_table.png', vwidth = 600, vheight = 600, expand = 10)

table| North Carolina Career Rebound Leaders | |||
|---|---|---|---|
| Player | Rebounds | Games | RPG |
Tyler Hansbrough
2005-09
|
1219 | 142 | 8.6 |
Armando Bacot
2019-present
|
1170 | 115 | 10.2 |
Sam Perkins
1980-84
|
1167 | 135 | 8.6 |
George Lynch
1989-93
|
1097 | 140 | 7.8 |
Billy Cunningham
1962-65
|
1062 | 69 | 15.4 |
Kennedy Meeks
2013-17
|
1052 | 144 | 7.3 |
Brice Johnson
2012-16
|
1035 | 148 | 7.0 |
Antawn Jamison
1995-98
|
1027 | 104 | 9.9 |
Mitch Kupchak
1972-76
|
1006 | 119 | 8.5 |
Brad Daugherty
1982-86
|
1003 | 135 | 7.4 |
Rusty Clark
1966-69
|
929 | 91 | 10.2 |
Pete Brennan
1955-58
|
854 | 81 | 10.5 |
Lennie Rosenbluth
1954-57
|
790 | 76 | 10.4 |
Sean May
2002-05
|
771 | 77 | 10.0 |
Doug Moe
1958-61
|
635 | 60 | 10.6 |
| @dadgumboxscores | January 8, 2023 | data via goheels.com | |||