Code
# pull data from wikipedia and filter by at least 15 appearaces
fh <- read_csv("fh_wiki.csv") %>% filter(App > 15)

# fix nas and replace with missed tournament
fh[is.na(fh)] <- "Missed Tournament"# pull data from wikipedia and filter by at least 15 appearaces
fh <- read_csv("fh_wiki.csv") %>% filter(App > 15)
# fix nas and replace with missed tournament
fh[is.na(fh)] <- "Missed Tournament"# find totals by pivoting longer
fh %>%
pivot_longer(cols = !c("Schools", "App"), names_to = "year", values_to = "finish") -> totals
# filter out northeastern (abitrarily) and missed tournaments
totals <- totals %>%
filter(finish != "Missed Tournament") %>%
filter(Schools != "Northeastern") %>%
mutate(finish = case_when(
finish %in% c("•", "16", "12", "QF") ~ "0",
finish == "CH" ~ "3",
finish == "SF" ~ "1",
finish == "RU" ~ "2",
TRUE ~ finish
))
final_counts <- totals %>%
mutate(Schools = fct_relevel(Schools, c("North Carolina", "Penn State", "Maryland", "Connecticut",
"Old Dominion", "Iowa", "Virginia", "Massachusetts", "Princeton", "Michigan", "Northwestern",
"Stanford", "Wake Forest", "Duke", "Syracuse"))) %>%
count(Schools, finish) %>%
select(Schools, finish, n)# theme
theme_me <- function () {
theme_minimal(base_size = 10, base_family = "RobotoCondensed-Regular") %+replace%
theme (
plot.title = element_text(
hjust = 0.5,
size = 18,
face = "bold",
lineheight = 0.75,
),
plot.subtitle = element_text(
hjust = 0.5,
size = 10,
lineheight = 0.25,
vjust = -3,
),
plot.caption = element_text(
hjust = 1,
size = 6,
lineheight = 0.35,
margin = margin(t = 20)
),
panel.grid.minor = element_blank(),
plot.background = element_rect(fill = "floral white", color = "floral white")
)
}# make the plot
fh_plot <- final_counts %>%
ggplot(aes(fill=finish, values=n)) +
geom_waffle(color = "floral white", size=.25, n_rows = 5, flip = TRUE, radius = unit(4, "pt"), height = 0.9, width = 0.9) +
facet_wrap(~Schools, nrow=3, strip.position = "bottom") +
scale_x_discrete(expand=c(0,0)) +
scale_y_continuous(labels = c(0, 10, 20, 30, 40),
expand = c(0,0)) +
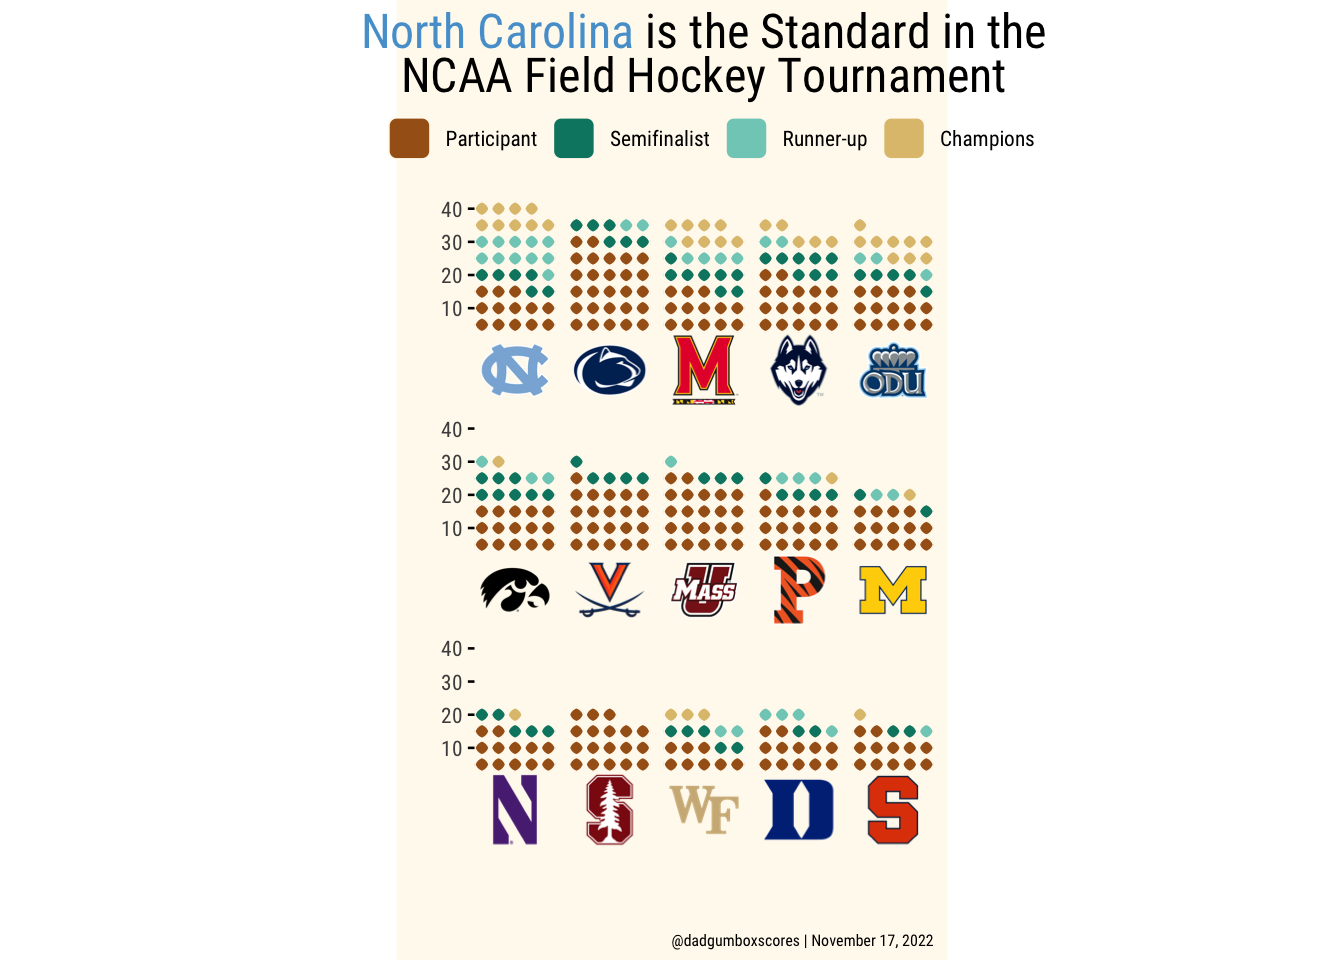
scale_fill_manual("",
values=c("0"="#a6611a", "1"="#018571", "2"="#80cdc1", "3"="#dfc27d"),
breaks=c("0", "1", "2", "3"),
labels=c("Participant", "Semifinalist", "Runner-up", "Champions")) +
coord_equal() +
labs(
title = "<span style='color:#56a0d3;'>North Carolina</span> is the Standard in the \nNCAA Field Hockey Tournament",
x = "",
y = "",
caption = "@dadgumboxscores | November 17, 2022"
) +
theme_me() +
theme(panel.grid = element_blank(),
axis.ticks.y = element_line()) +
guides(fill = guide_legend()) +
theme(legend.position = "top", strip.text = element_cfb_logo(size = 1), plot.title = element_markdown(), plot.subtitle = element_markdown())
# save image of plot
ggsave(
"fh.png",
fh_plot,
w = 7,
h = 7,
dpi = 300,
type = 'cairo'
)
fh_plot